

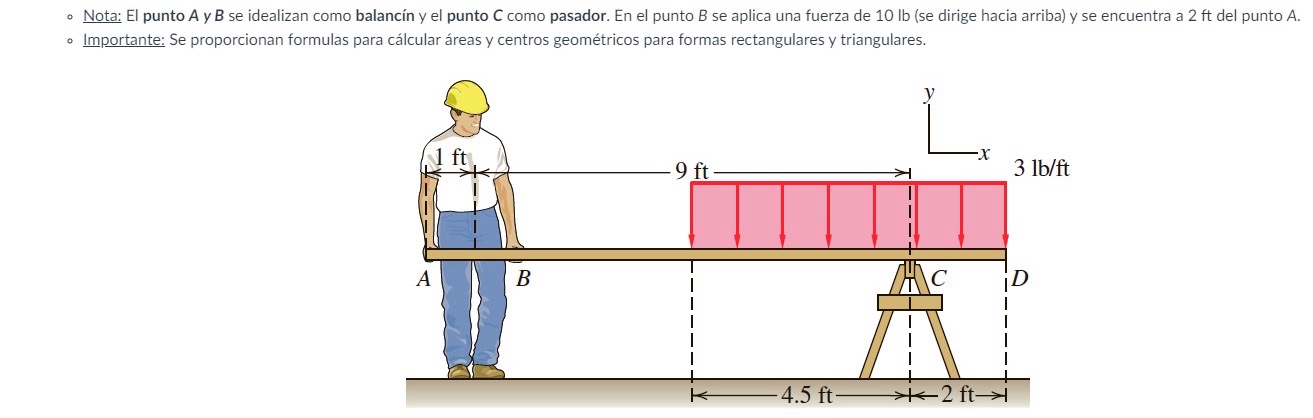
Question: Use the graphical method to plot the shear force and bending moment diagrams. Next, identify Mmax and Vmax and the respective locations where they occur.
Use the graphical method to plot the shear force and bending moment diagrams. Next, identify Mmax and Vmax and the respective locations where they occur. Note: Point A and B are idealized as a seesaw and point C as a pin. A force of lb is applied at point B it is directed upward and it is ft from point A Important: Formulas are provided to calculate areas and geometric centers for rectangular and triangular shapes.
Step by Step Solution
There are 3 Steps involved in it
1 Expert Approved Answer
Step: 1 Unlock

Question Has Been Solved by an Expert!
Get step-by-step solutions from verified subject matter experts
Step: 2 Unlock
Step: 3 Unlock