

Question: Use the Group column and perform horizontal analysis on - add up the figure in non current liabilities and non-current liabilities and use for calculation.
Use the Group column and perform horizontal analysis on - add up the figure in non current liabilities and non-current liabilities and use for calculation.
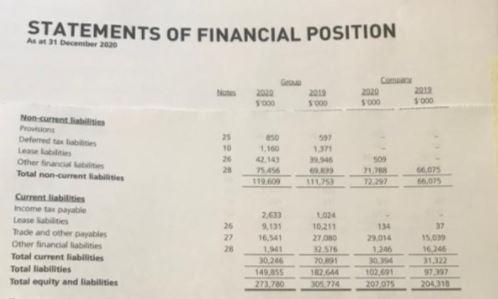
Use 2019 as the base year and 2020 as the current year. From the answer, comment on the company's performance - is it improving or deteriorating compared to 2019?
i type figures below as screen shot is not clear:
Non - current liabilities:
Other financial liabilities 75,456 69,839
Current liabilities:
Other financial liabilities 1,941 32,576
STATEMENTS OF FINANCIAL POSITION A 31 December 2020 2000 000 2020 5000 SOOD 3000 Non- Foto be 50 25 10 20 51 1.31 Other Total non-currenties 21 754 . 111 66.07 56,015 12297 Current Babies Income to pay Los abilities Trade and others Other financial abilities Total current liabilities Total liabilities Total equity and liabilities 25 27 20 200 9,031 16.541 1. 020 149.5 134 29.01 1146 17 15.00 10.211 27.000 2575 70.91 12.44 714 LLL 17 103631 202075 31.122 97137 204310
Step by Step Solution
There are 3 Steps involved in it

Get step-by-step solutions from verified subject matter experts