

Question: Use the image attached for the question below. Year undergrad enrollment total LSUS credit hour production 1989 undergrad tuition and fees 3,594 1990 94,450 ,540
Use the image attached for the question below.
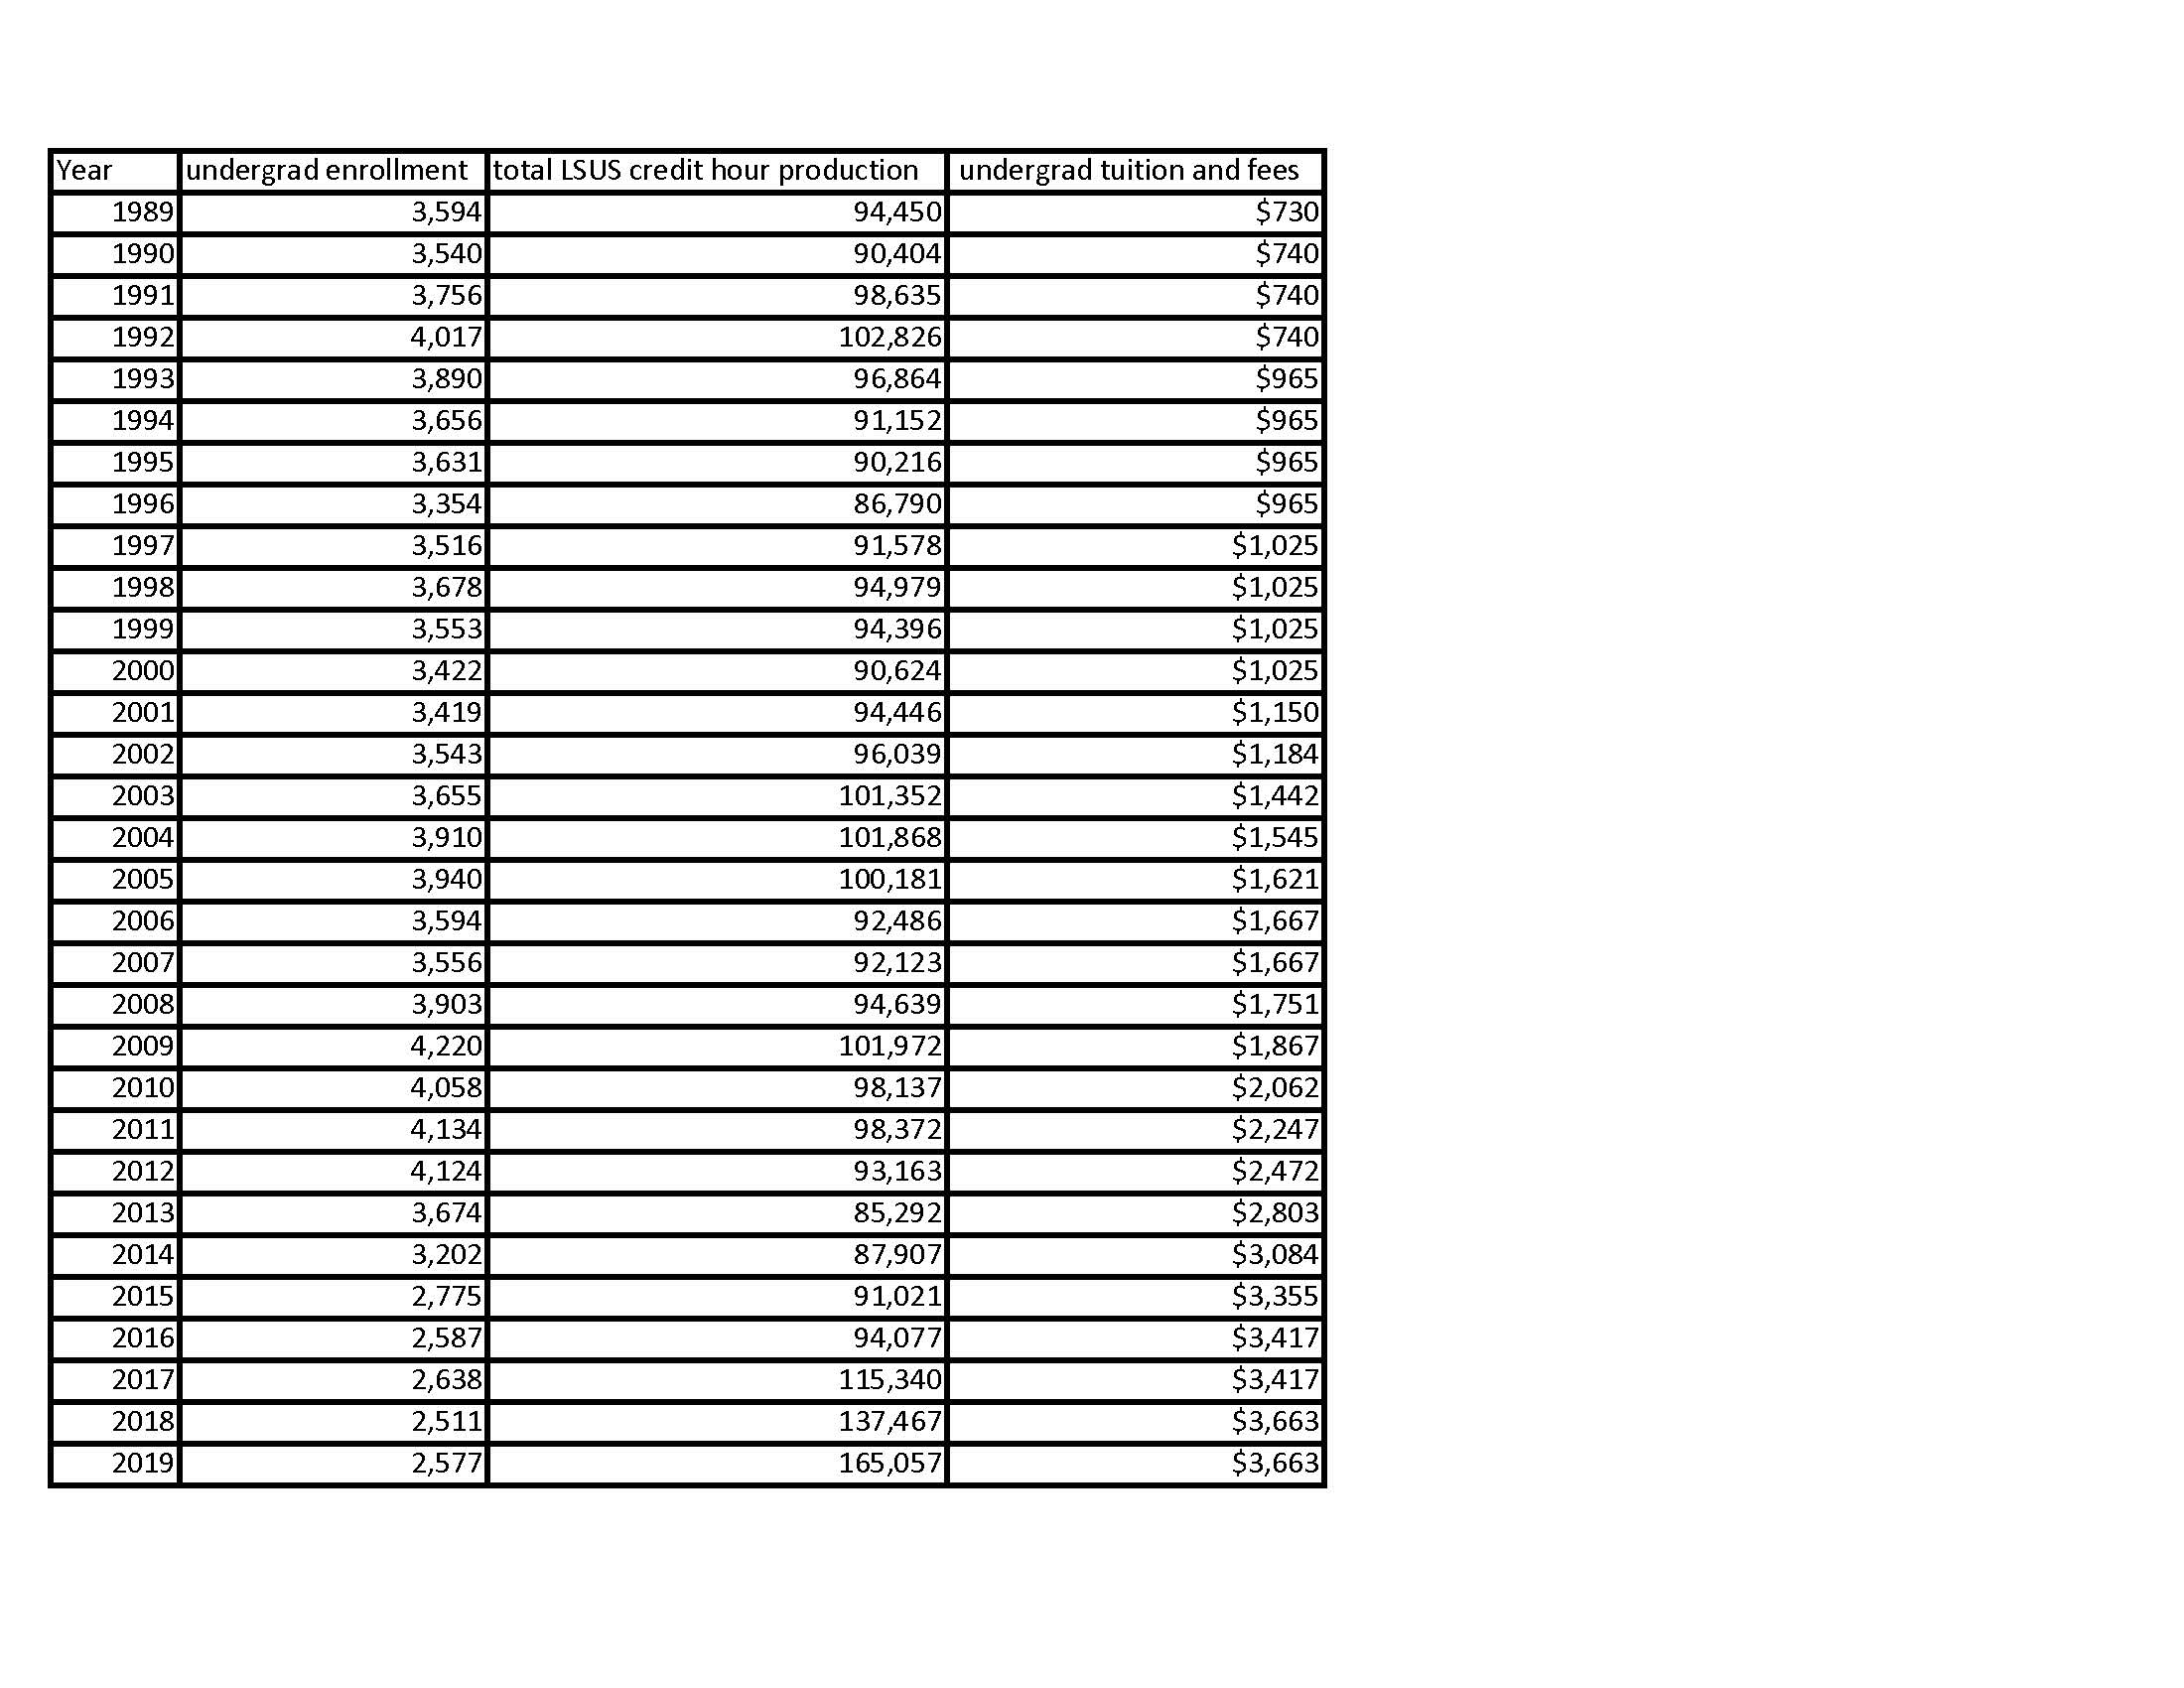
Year undergrad enrollment total LSUS credit hour production 1989 undergrad tuition and fees 3,594 1990 94,450 ,540 $730 991 90,404 3,756 $740 98,635 1992 4,017 $740 .993 102,826 3,890 740 1994 96,864 3,656 965 1995 91,152 ,631 965 .996 90,216 ,354 $965 199 86,790 3,516 $965 1998 91,578 3,678 $1,025 999 94,979 3,553 1,025 2000 94,396 3,422 $1,025 90,624 2001 ,419 $1,025 94,446 2002 3,543 $1,150 2003 96,039 3,655 $1,184 2004 101,352 3,910 $1,442 2005 101,868 3,940 $1,545 2006 100,181 ,594 $1,621 200 92,486 3,556 $1,667 2008 92,123 $,903 $1,667 94,639 2009 ,220 $1,751 2010 101,972 1,058 $1,867 2011 98,137 ,134 $2,062 2012 98,372 1,124 $2,247 2013 93,163 3,674 $2,472 2014 85,292 3,202 $2,803 201! 87,907 1,775 $3,084 2016 1,021 2,587 $3,355 2017 94,077 ,638 $3,417 15,340 201 2,511 $3,417 2019 137,467 2,577 $3,663 165,057 $3,663
Step by Step Solution
There are 3 Steps involved in it

Get step-by-step solutions from verified subject matter experts