

Question: Use the Images Provided (The Data Sets and Info) to answer the following questions for both sets. 8. Interpret the 95% confidence interval on both
Use the Images Provided (The Data Sets and Info) to answer the following questions for both sets.
8. Interpret the 95% confidence interval on both sheets, use Statistical language and the content of the data set (Nitrate Levels of Lost Creek) correctly.
9. Use the 95% confidence intervals from both data sets to discuss the change in the population mean nitrate level of Lost Creek from 2000 to 2015. Has the population mean nitrate level increased? Is it
possible the population mean is the same over
the 15 years or even decreased. Explain using statistical language and values confidence intervals. Write complete sentences, spell accurately, and punctuate and capitalize as needed.
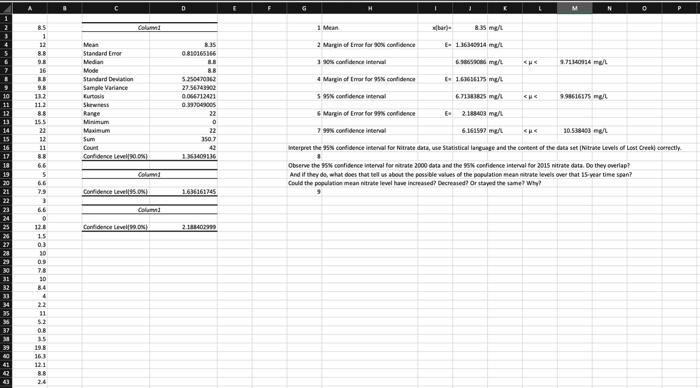
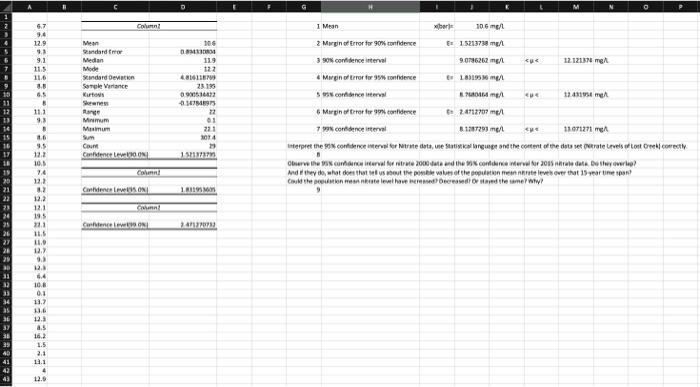
Observe the 95W confidence interval for novate 2000 dyta and the 95% confidence interval for 2015 nitrate data. Do they ooerlap? B 9
Step by Step Solution
There are 3 Steps involved in it

Get step-by-step solutions from verified subject matter experts