Question: USE THE INFORMATION BELOW TO ANSWER SECTION A AND B. The following are information and extract of financial statements for MS Tech Berhad, a manufacturer
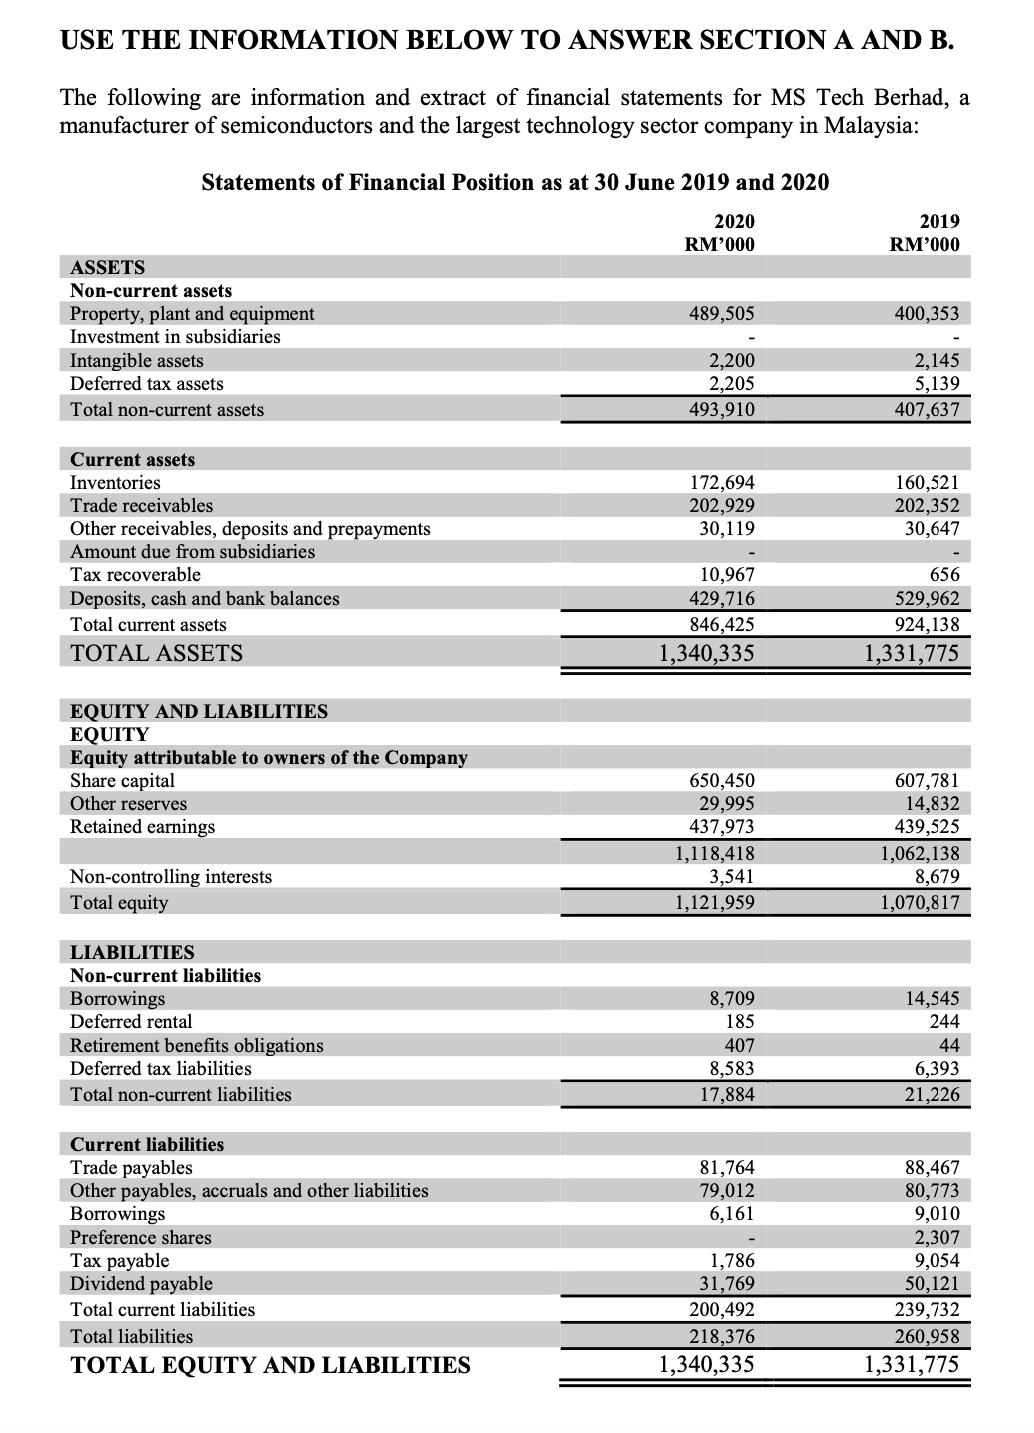
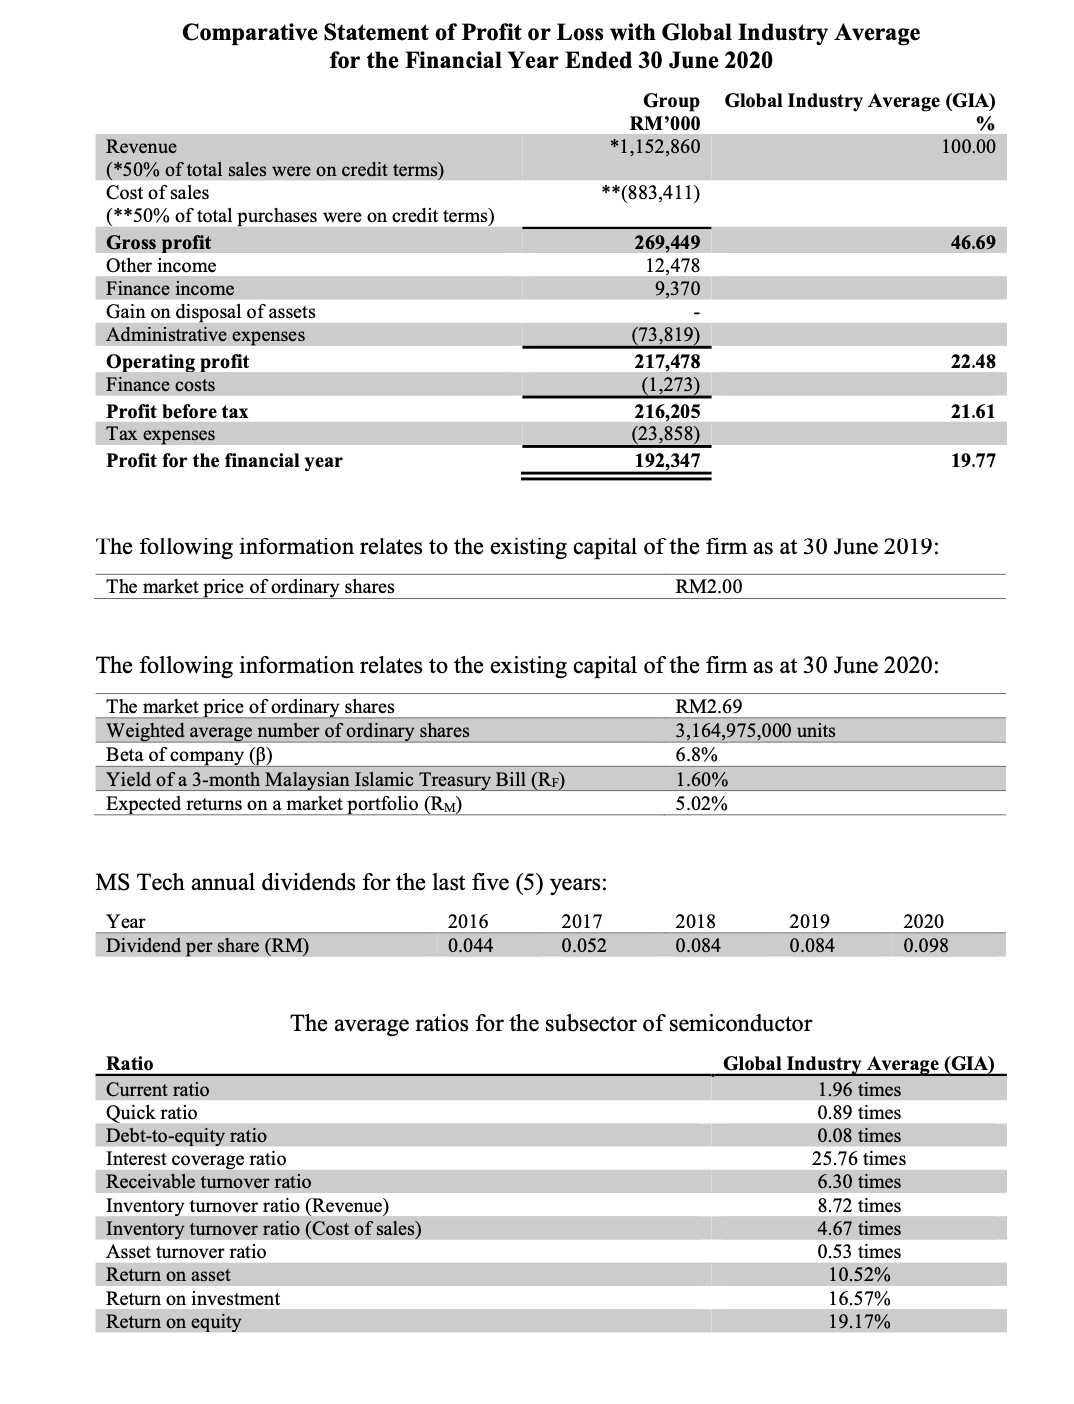
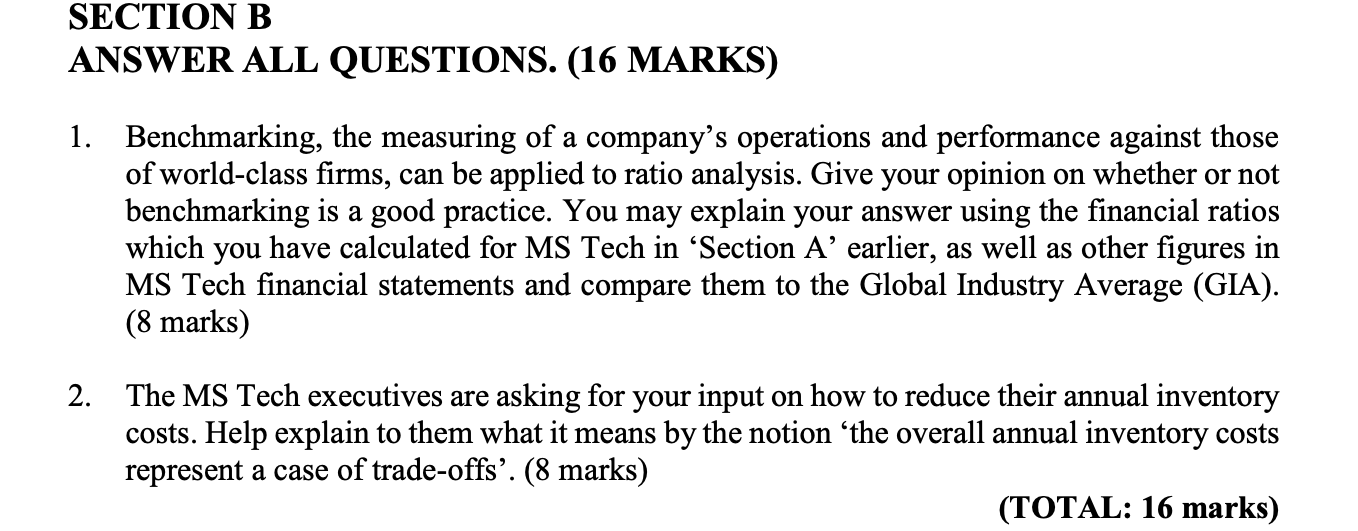
USE THE INFORMATION BELOW TO ANSWER SECTION A AND B. The following are information and extract of financial statements for MS Tech Berhad, a manufacturer of semiconductors and the largest technology sector company in Malaysia: Statements of Financial Position as at 30 June 2019 and 2020 2020 2019 RM'000 RM'000 ASSETS Non-current assets Property, plant and equipment 489,505 400,353 Investment in subsidiaries Intangible assets 2,200 2,145 Deferred tax assets 2,205 5,139 Total non-current assets 493,910 407,637 Current assets Inventories 172,694 160,521 Trade receivables 202,929 202,352 Other receivables, deposits and prepayments 30,119 30,647 Amount due from subsidiaries Tax recoverable 10,967 656 Deposits, cash and bank balances 429,716 529,962 Total current assets 846.425 924,138 TOTAL ASSETS 1,340,335 1,331,775 EQUITY AND LIABILITIES EQUITY Equity attributable to owners of the Company Share capital 650,450 607,781 Other reserves 29,995 14,832 Retained earnings 437,973 439,525 1,118,418 1,062,138 Non-controlling interests 3,541 3,679 Total equity 1, 121,959 ,070,817 LIABILITIES Non-current liabilities Borrowings 8,709 14,545 Deferred rental 185 244 Retirement benefits obligations 407 44 Deferred tax liabilities 8.583 6,393 Total non-current liabilities 17,884 21,226 Current liabilities Trade payables 81,764 88,467 Other payables, accruals and other liabilities 79,012 80,773 Borrowings 6,161 9,010 Preference shares 2,307 Tax payable 1,786 9.054 Dividend payable 31,769 50,121 Total current liabilities 200,492 239,732 Total liabilities 218,376 260,958 TOTAL EQUITY AND LIABILITIES 1,340,335 1,331,775Comparative Statement of Profit or Loss with Global Industry Average for the Financial Year Ended 30 June 2020 Group Global Industry Average (GIA) RM'000 % Revenue *1,152,860 100.00 (*50% of total sales were on credit terms) Cost of sales **(883,411) (**50% of total purchases were on credit terms) Gross profit 269,449 46.69 Other income 12,478 Finance income 9,370 Gain on disposal of assets Administrative expenses (73,819) Operating profit 217,478 22.48 Finance costs (1,273) Profit before tax 216,205 21.61 Tax expenses (23,858) Profit for the financial year 192,347 19.77 The following information relates to the existing capital of the firm as at 30 June 2019: The market price of ordinary shares RM2.00 The following information relates to the existing capital of the firm as at 30 June 2020: The market price of ordinary shares RM2.69 Weighted average number of ordinary shares 3,164,975,000 units Beta of company (B) 6.8% Yield of a 3-month Malaysian Islamic Treasury Bill (RF) 1.60% Expected returns on a market portfolio (RM) 5.02% MS Tech annual dividends for the last five (5) years: Year 2016 2017 2018 2019 2020 Dividend per share (RM) 0.044 0.052 0.084 0.084 0.098 The average ratios for the subsector of semiconductor Ratio Global Industry Average (GIA) Current ratio 1.96 times Quick ratio 0.89 times Debt-to-equity ratio 0.08 times Interest coverage ratio 25.76 times Receivable turnover ratio 6.30 times Inventory turnover ratio (Revenue) 8.72 times Inventory turnover ratio (Cost of sales) 4.67 times Asset turnover ratio 0.53 times Return on asset 10.52% Return on investment 16.57% Return on equity 19.17%SECTION B ANSWER ALL QUESTIONS. (16 MARKS) 1. Benchmarking, the measuring of a company's operations and performance against those of world-class rms, can be applied to ratio analysis. Give your opinion on whether or not benchmarking is a good practice. You may explain your answer using the nancial ratios which you have calculated for MS Tech in 'Section A' earlier, as well as other gures in MS Tech nancial statements and compare them to the Global Industry Average (GIA). (8 marks) The MS Tech executives are asking for your input on how to reduce their annual inventory costs. Help explain to them what it means by the notion 'the overall annual inventory costs represent a case of trade-offs'. (8 marks) (TOTAL: 16 marks)