

Question: use the information below to complete the charts. Construct and Interpret a Product Profitability Report, Allocating Seling and Administrative Expenses Naper Inc. manufactures power equipment.
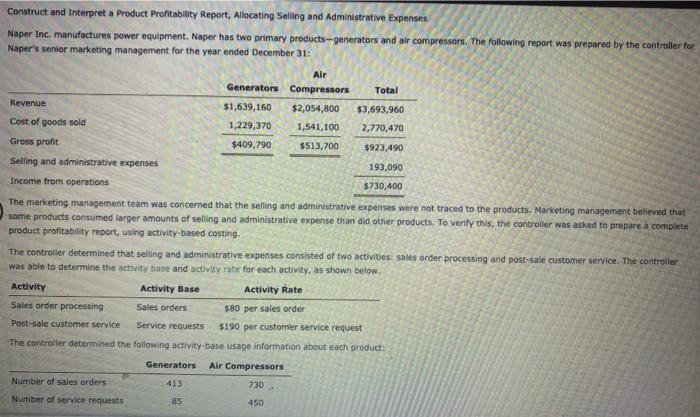
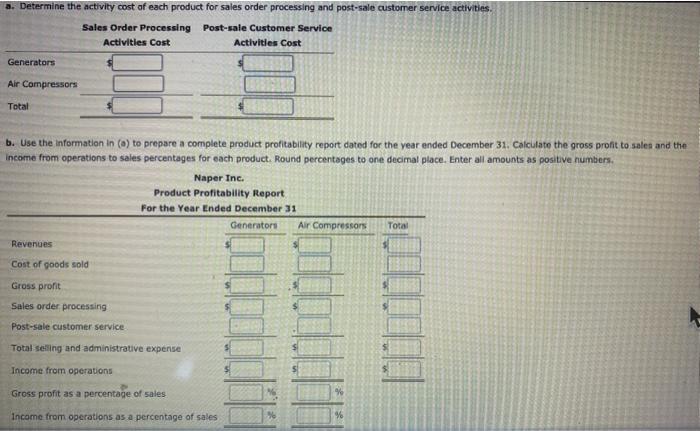
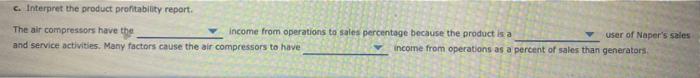
Construct and Interpret a Product Profitability Report, Allocating Seling and Administrative Expenses Naper Inc. manufactures power equipment. Naper has two primary products-generators and air compressors. The following report was prepared by the controller for Naper's senior marketing management for the year ended December 31: Air Generators Compressors Total Revenue $1,639,160 $2,054,800 $3,693,960 Cost of goods sold 1,229,370 1,541,100 2,770,470 Gross profit $409,790 $513,700 $923,490 Selling and administrative expenses 193,090 Income from operations 5730,400 The marketing management team was concerned that the selling and administrative expenses were not traced to the products. Marketing management believed that some products consumed larger amounts of selling and administrative expense than did other products. To verify this, the controller was asked to prepare a complete product profitability report, using activity based costing. The controller determined that selling and administrative expenses consisted of two activitiessales order processing and post-sale customer service. The controller was able to determine the activity base and activity rate for each activity, as shown below. Activity Activity Base Activity Rate Sales order processing Sales orders 580 per sales order Post-sale customer service Service requests $190 per customer service request The controller determined the following activity-base usage information about each product: Generators Air Compressors 413 730 Number of sales orders Number of service requests 85 450 a. Determine the activity cost of each product for sales order processing and post-sale customer service activities Sales Order Processing Activities Cost Post-sale Customer Service Activities Cost Generators Air Compressors Total b. Use the Information in () to prepare a complete product profitability report dated for the year ended December 31. Calculate the gross profit to sales and the Income from operations to sales percentages for each product. Round percentages to one decimal place. Enter all amounts as positive numbers. Naper Inc. Product Profitability Report For the Year Ended December 31 Air Compressors Generators Total Revenues Cost of goods sold Gross profit Sales order processing Post-sale customer service Total selling and administrative expense Income from operations Gross profit as a percentage of sales % Income from operations as a percentage of sales % 6. Interpret the product profitability report. The air compressors have the Income from operations to sales percentage because the product is a user of Naper's sales and service activities. Many factors cause the air compressors to have income from operations as a percent of sales than generators
Step by Step Solution
There are 3 Steps involved in it

Get step-by-step solutions from verified subject matter experts