

Question: Use the information below to plot a D log E curve, & answer the questions: Relative 1 2 4 8 16 32 64 128 256
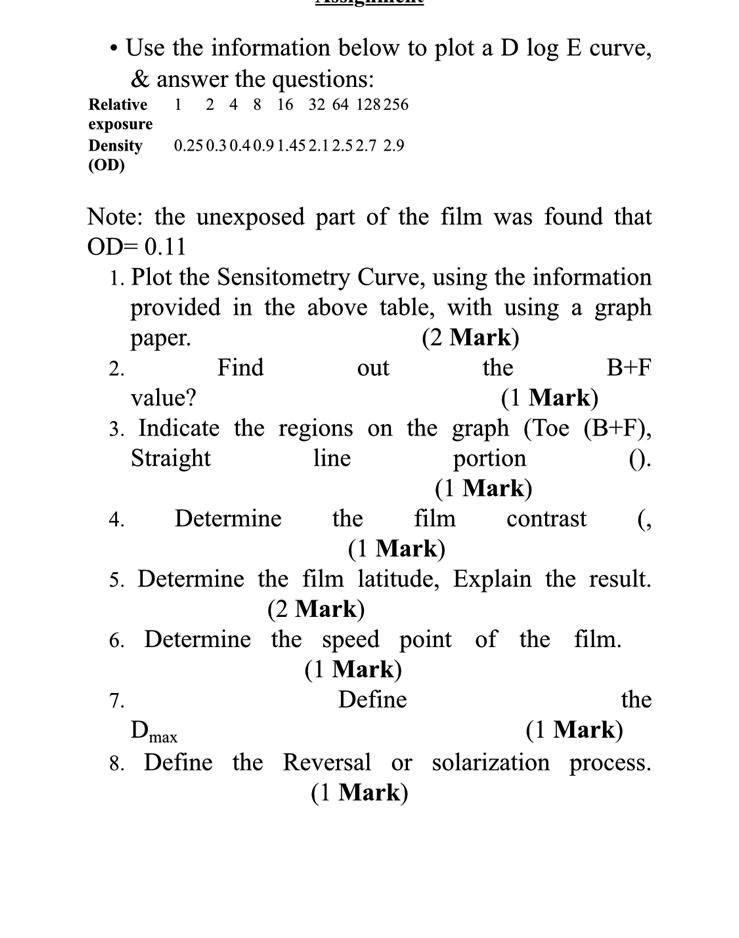
Use the information below to plot a D log E curve, & answer the questions: Relative 1 2 4 8 16 32 64 128 256 exposure Density 0.250.30.40.91.45 2.1 2.5 2.7 2.9 (OD) 0. Note: the unexposed part of the film was found that OD=0.11 1. Plot the Sensitometry Curve, using the information provided in the above table, with using a graph paper. (2 Mark) 2. Find out the B+F value? (1 Mark) 3. Indicate the regions on the graph (Toe (B+F), Straight line portion (1 Mark) 4. Determine the film contrast (, (1 Mark) 5. Determine the film latitude, Explain the result. (2 Mark) 6. Determine the speed point of the film. (1 Mark) 7. Define the (1 Mark) 8. Define the Reversal or solarization process. (1 Mark) Dmax Use the information below to plot a D log E curve, & answer the questions: Relative 1 2 4 8 16 32 64 128 256 exposure Density 0.250.30.40.91.45 2.1 2.5 2.7 2.9 (OD) 0. Note: the unexposed part of the film was found that OD=0.11 1. Plot the Sensitometry Curve, using the information provided in the above table, with using a graph paper. (2 Mark) 2. Find out the B+F value? (1 Mark) 3. Indicate the regions on the graph (Toe (B+F), Straight line portion (1 Mark) 4. Determine the film contrast (, (1 Mark) 5. Determine the film latitude, Explain the result. (2 Mark) 6. Determine the speed point of the film. (1 Mark) 7. Define the (1 Mark) 8. Define the Reversal or solarization process. (1 Mark) Dmax
Step by Step Solution
There are 3 Steps involved in it

Get step-by-step solutions from verified subject matter experts