

Question: Use the information from Question 9 Ten statistics classes were randomly selected, and the number of students enrolled in each class was recorded. 30,
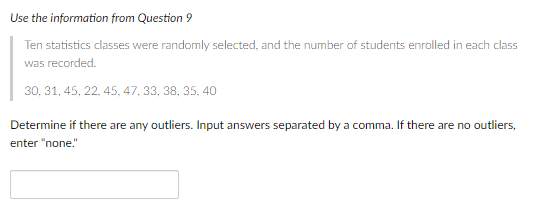
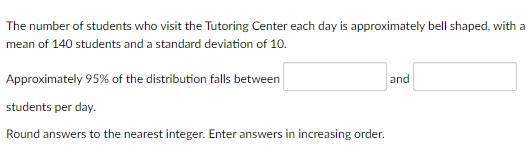
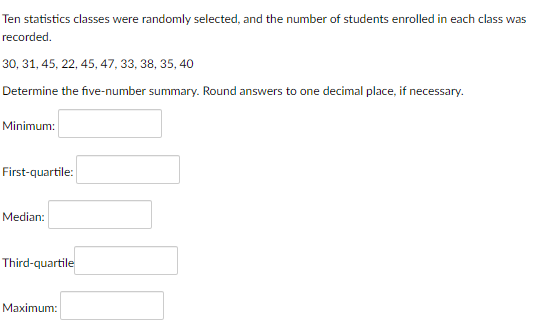
Use the information from Question 9 Ten statistics classes were randomly selected, and the number of students enrolled in each class was recorded. 30, 31, 45, 22, 45, 47, 33, 38, 35, 40 Determine if there are any outliers. Input answers separated by a comma. If there are no outliers, enter "none." The number of students who visit the Tutoring Center each day is approximately bell shaped, with a mean of 140 students and a standard deviation of 10. Approximately 95% of the distribution falls between students per day. Round answers to the nearest integer. Enter answers in increasing order. and Ten statistics classes were randomly selected, and the number of students enrolled in each class was recorded. 30, 31, 45, 22, 45, 47, 33, 38, 35, 40 Determine the five-number summary. Round answers to one decimal place, if necessary. Minimum: First-quartile: Median: Third-quartile Maximum:
Step by Step Solution
There are 3 Steps involved in it

Get step-by-step solutions from verified subject matter experts