

Question: Use the information from the graph to answer the following question. What fraction of the sample represents people with type A blood? Sample by blood
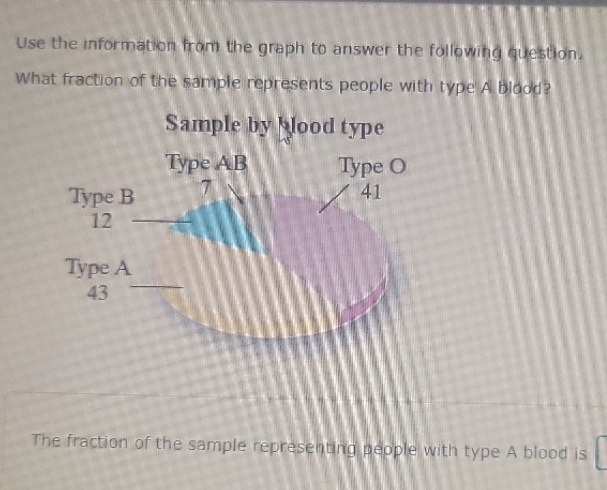
Use the information from the graph to answer the following question. What fraction of the sample represents people with type A blood? Sample by blood type Type AB Type O Type B 7 41 12 Type A 43 The fraction of the sample representing people with type A blood is
Step by Step Solution
There are 3 Steps involved in it
1 Expert Approved Answer
Step: 1 Unlock

Question Has Been Solved by an Expert!
Get step-by-step solutions from verified subject matter experts
Step: 2 Unlock
Step: 3 Unlock