

Question: Use the information from the Tableau dashboard to answer the following questions. Year Companies on the DOW Jones (Market Cap) (AII) 5B Company AIG 4B
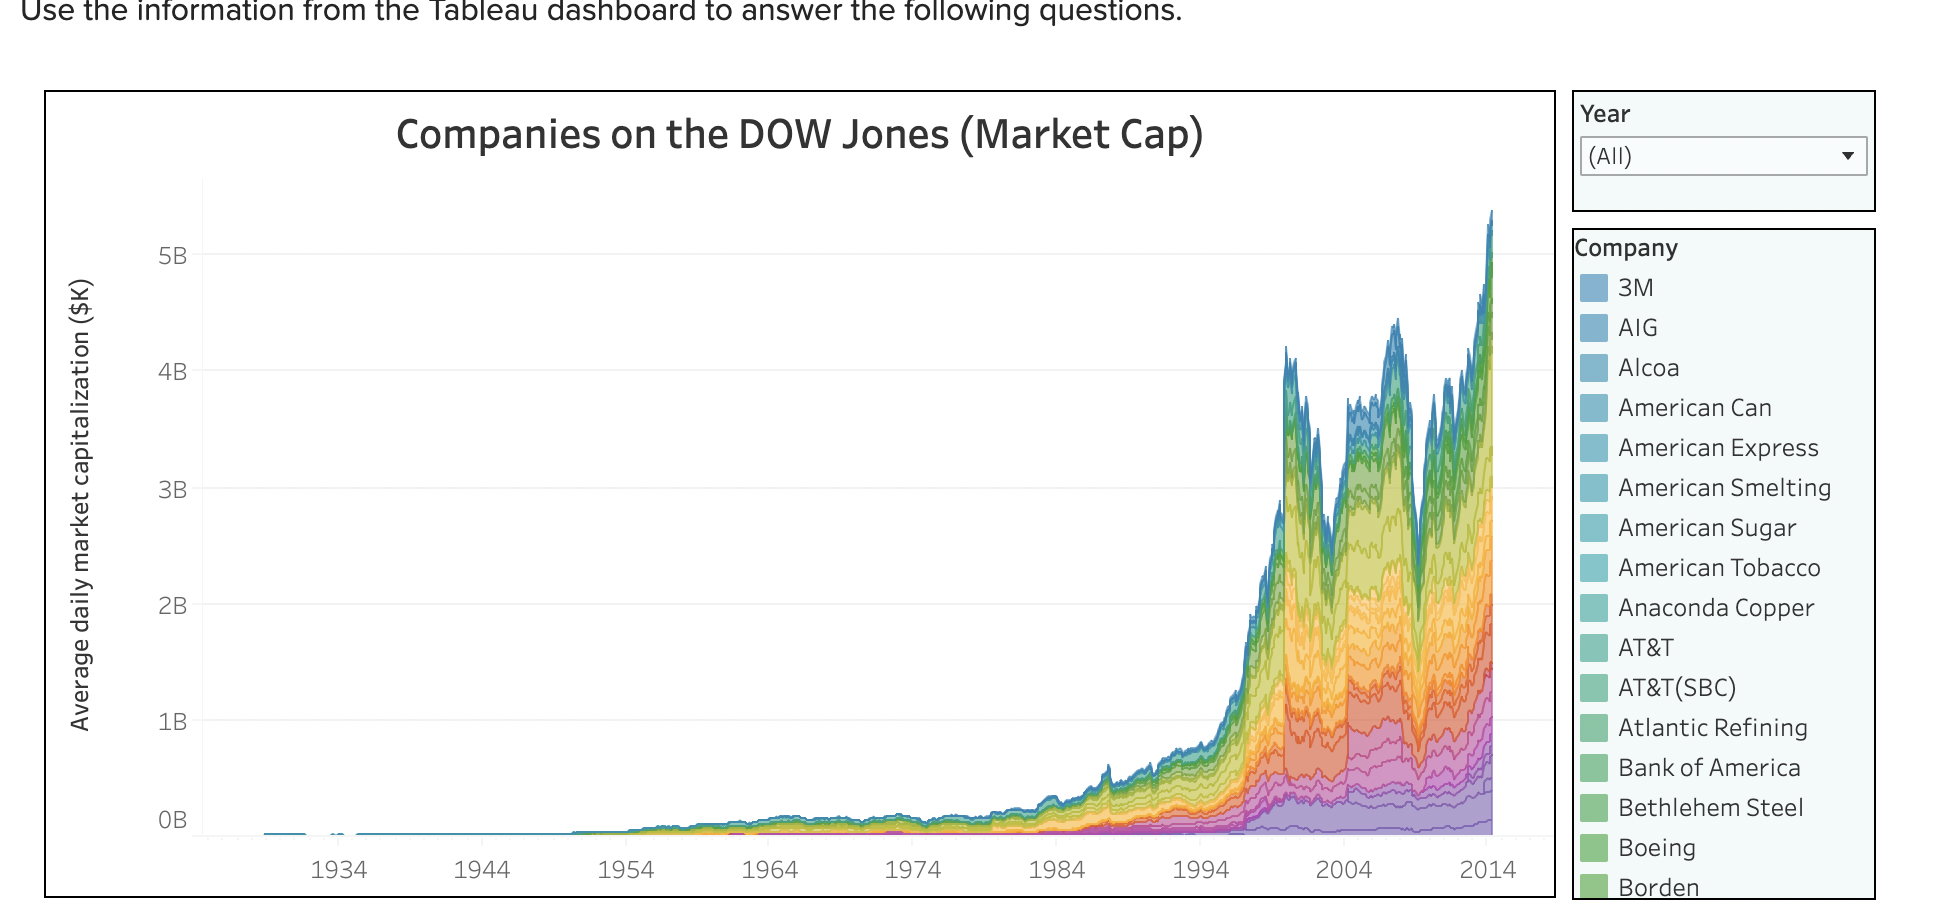
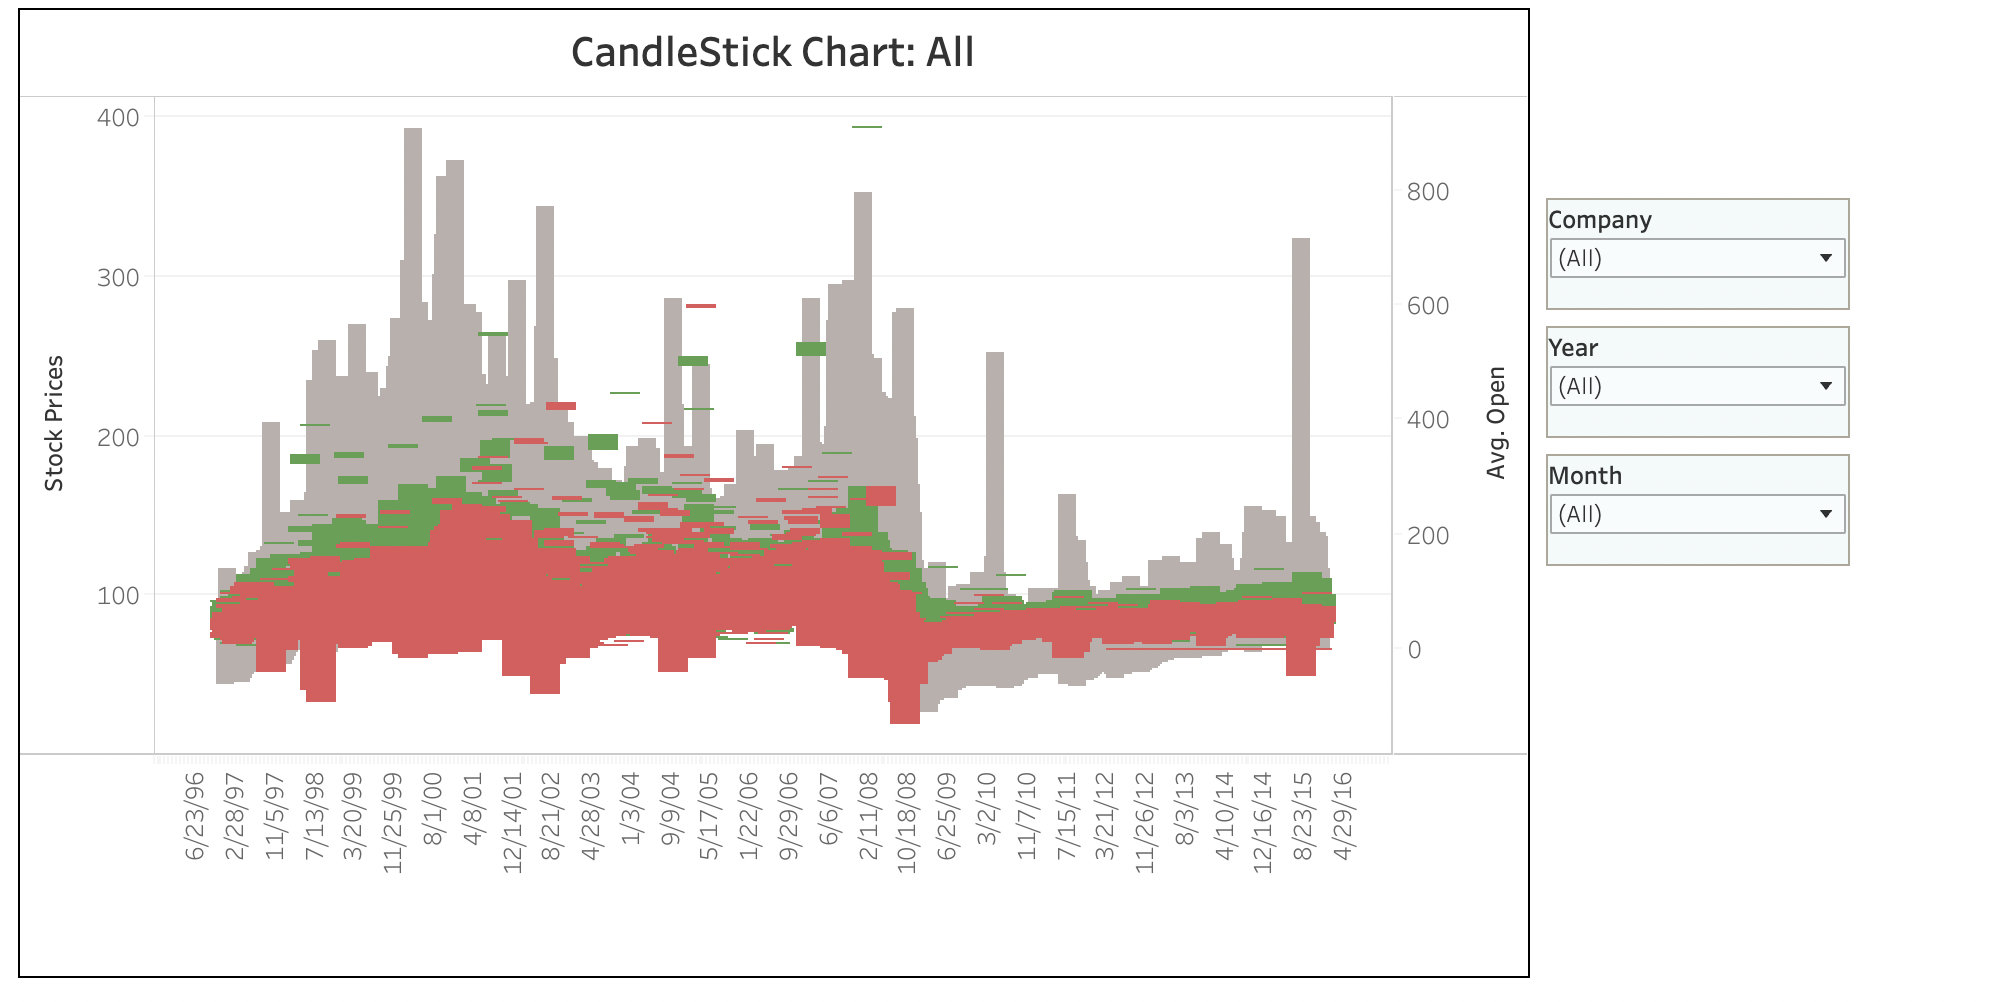
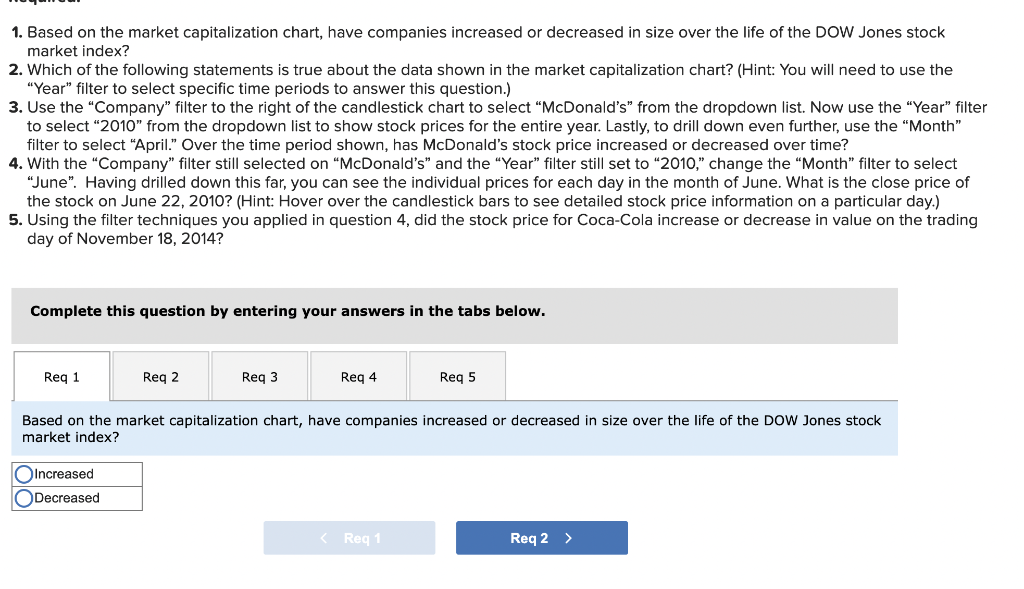
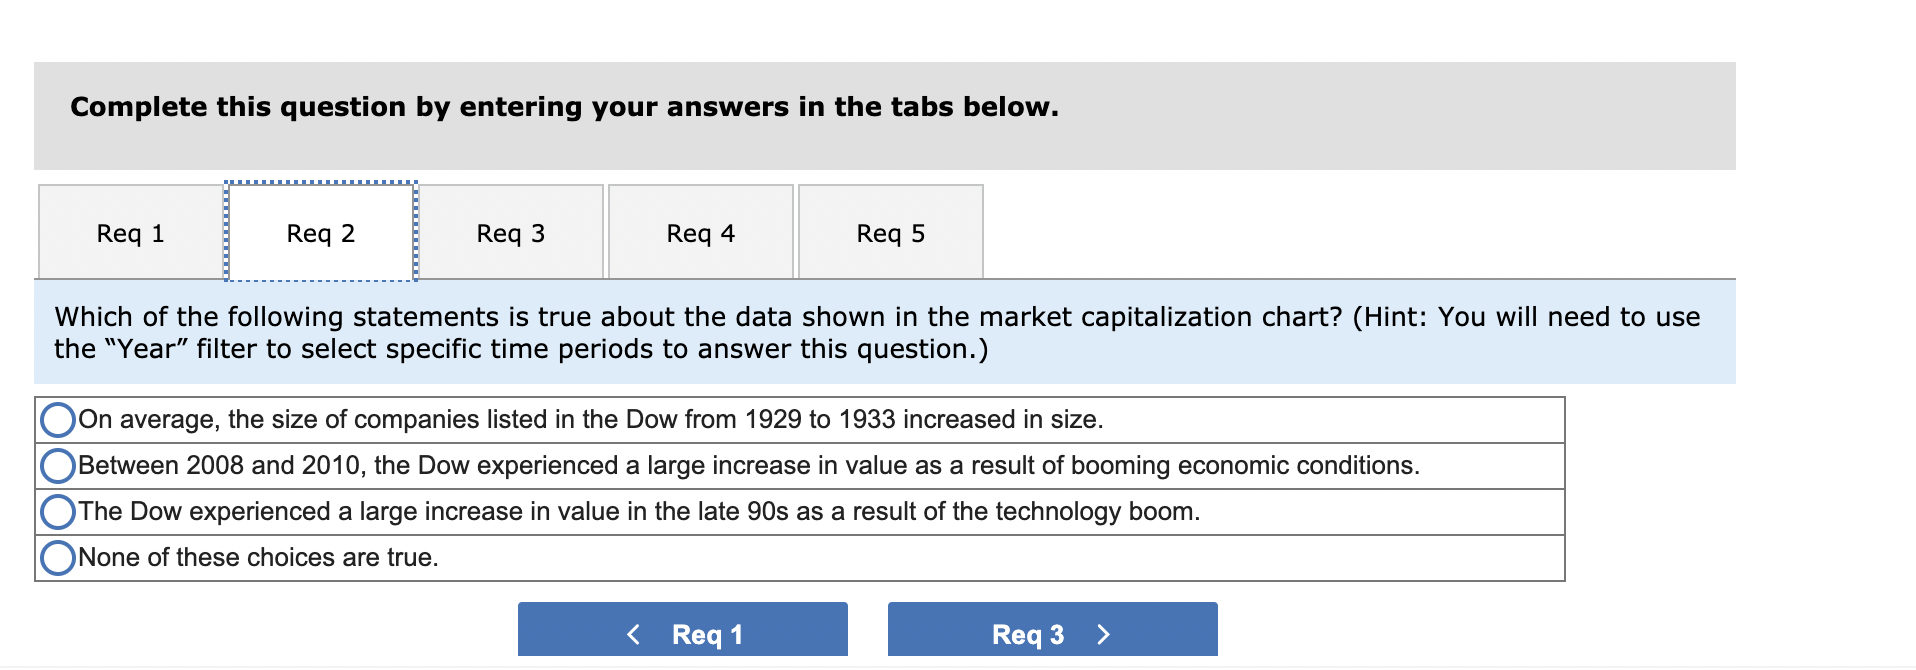
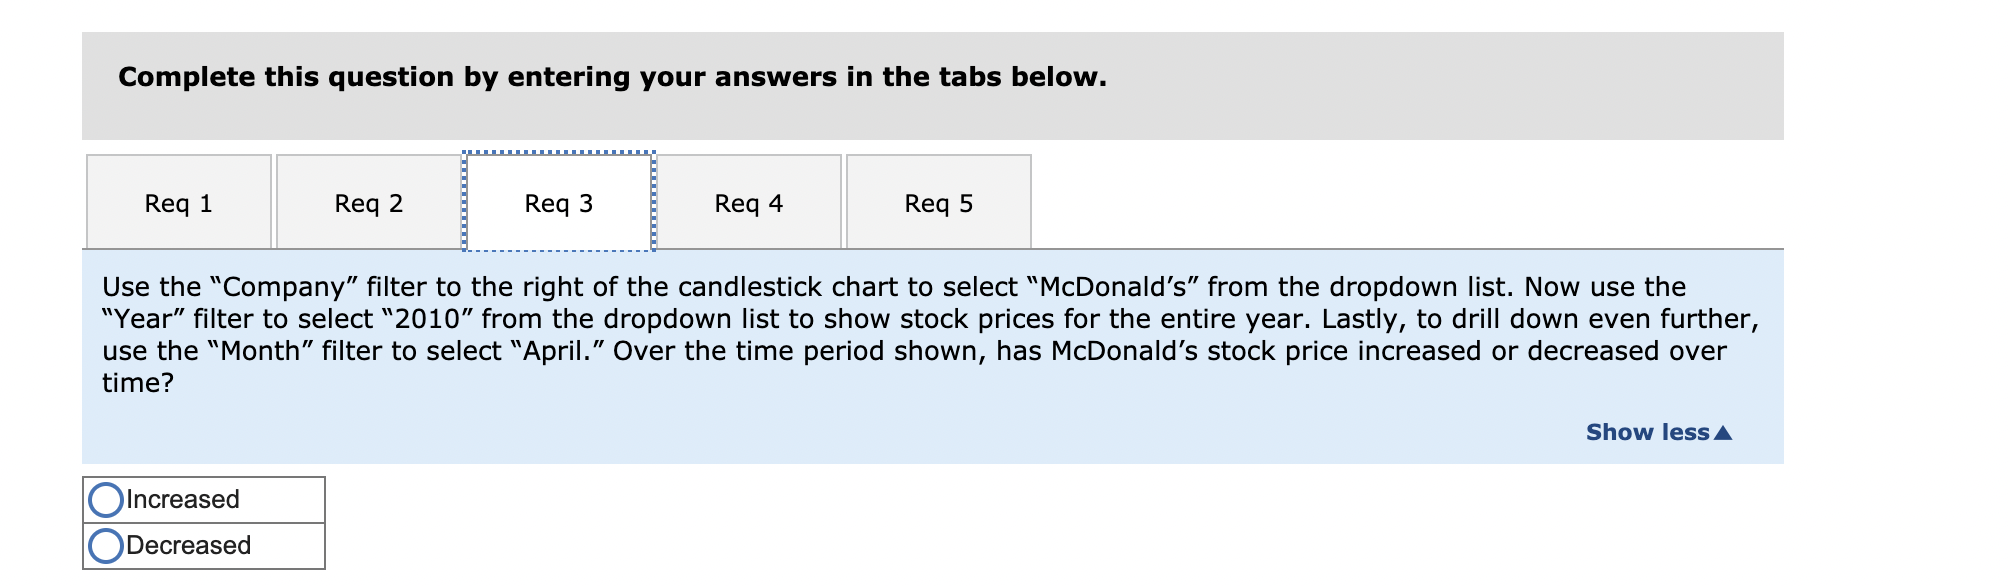
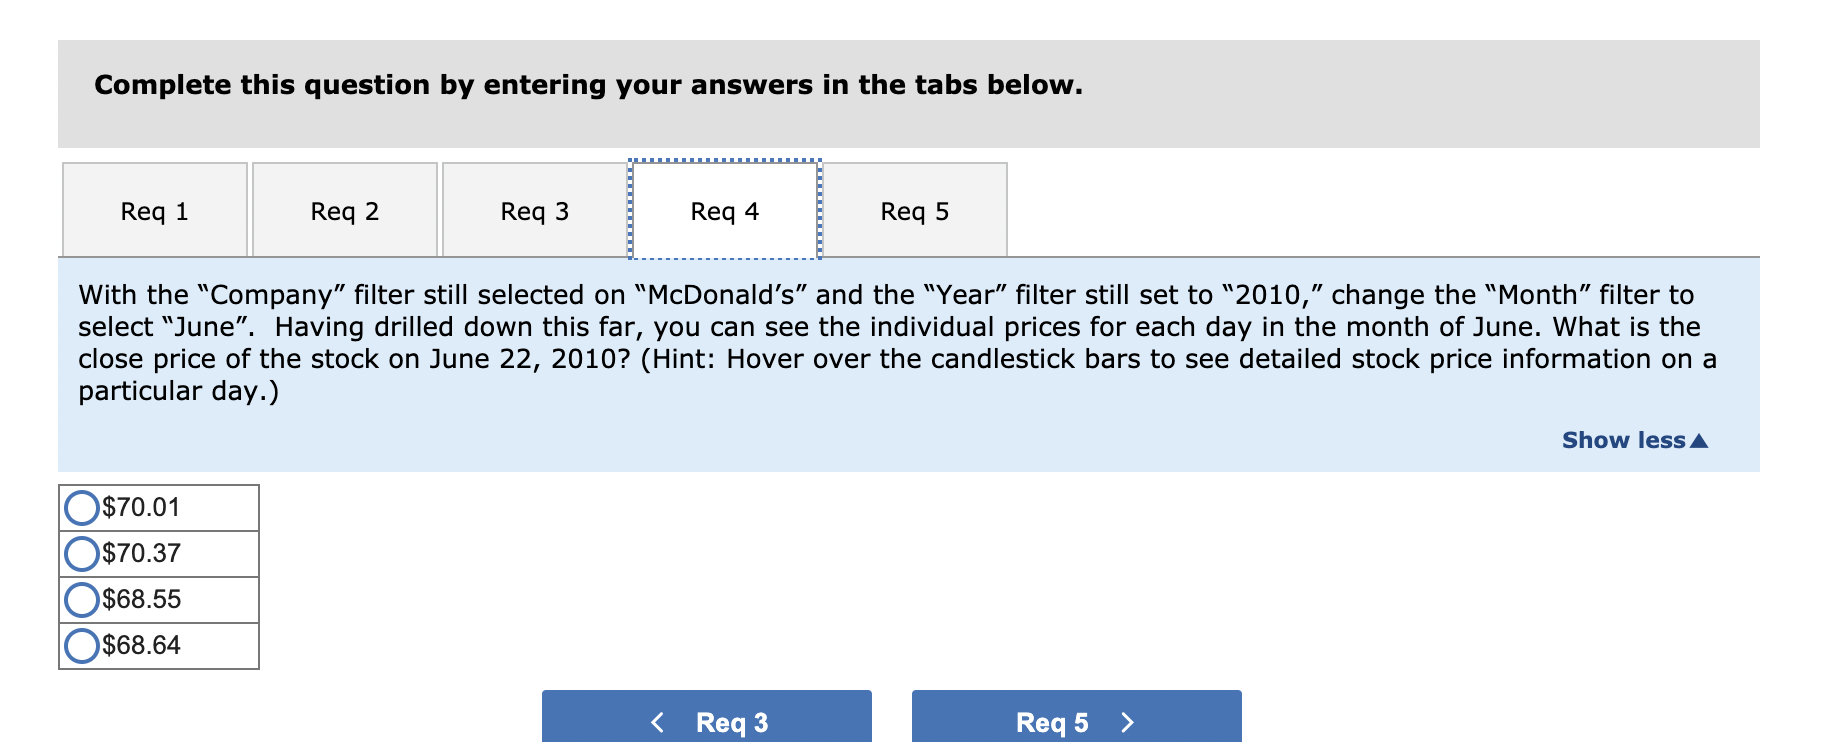
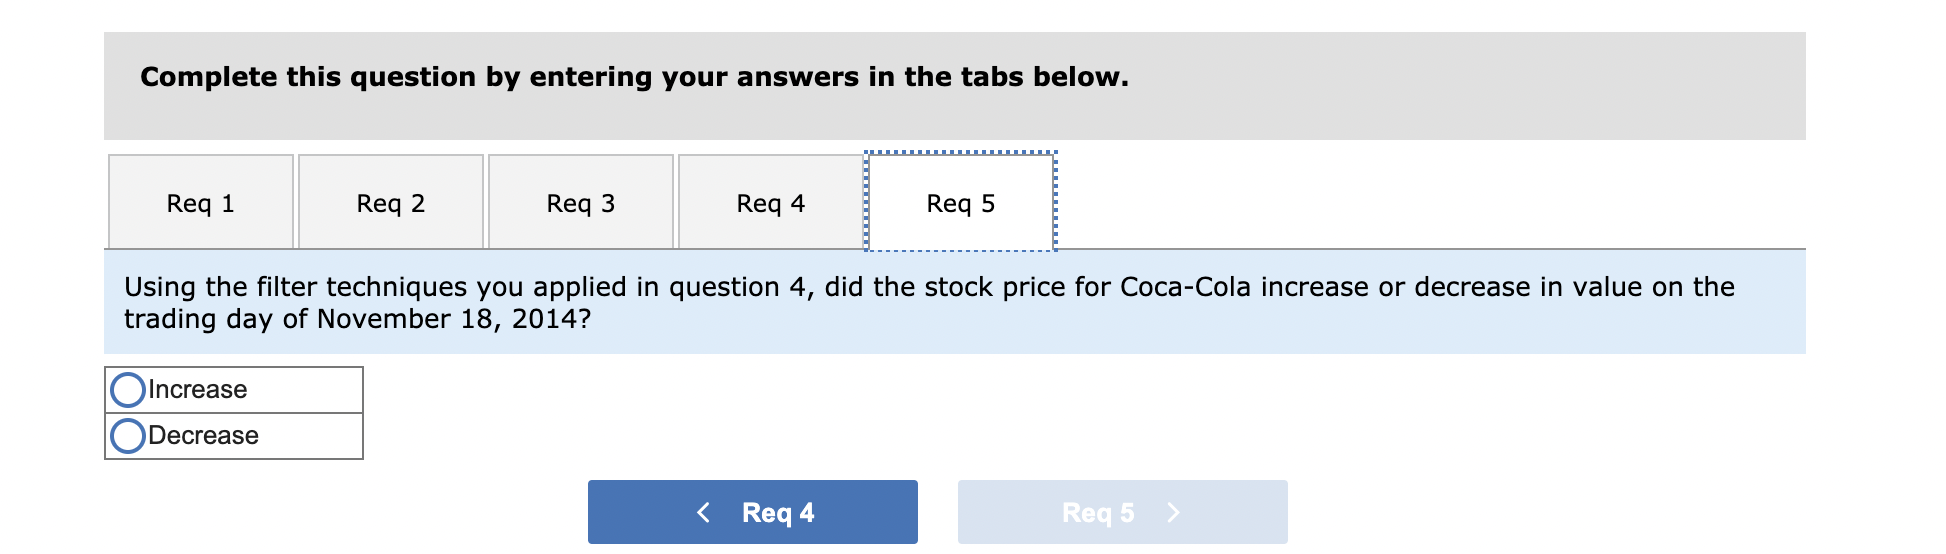
Use the information from the Tableau dashboard to answer the following questions. Year Companies on the DOW Jones (Market Cap) (AII) 5B Company AIG 4B Alcoa Average daily market capitalization ($K) American Can American Express American Smelting American Sugar American Tobacco Anaconda Copper AT&T AT&T(SBC) Atlantic Refining Bank of America 2B 1B Bethlehem Steel OB 1934 1944 1954 1964 1974 1984 1994 2004 2014 Boeing Borden Stock Prices 100 200 300 400 6/23/96 2/28/97 11/5/97 7/13/98 3/20/99 11/25/99 8/1/00 4/8/01 12/14/01 8/21/02 4/28/03 1/3/04 9/9/04 5/17/05 1/22/06 9/29/06 6/6/07 2/11/08 10/18/08 6/25/09 3/2/10 11/7/10 7/15/11 3/21/12 11/26/12 8/3/13 4/10/14 12/16/14 8/23/15 4/29/16 Candlestick Chart: All o 200 400 600 800 Avg. Open (All) Month (All) Year (All) Company 1. Based on the market capitalization chart, have companies increased or decreased in size over the life of the DOW Jones stock market index? 2. Which of the following statements is true about the data shown in the market capitalization chart? (Hint: You will need to use the "Year filter to select specific time periods to answer this question.) 3. Use the "Company" filter to the right of the candlestick chart to select "McDonald's" from the dropdown list. Now use the "Year" filter to select "2010" from the dropdown list to show stock prices for the entire year. Lastly, to drill down even further, use the "Month" filter to select "April." Over the time period shown, has McDonald's stock price increased or decreased over time? 4. With the "Company" filter still selected on McDonald's" and the "Year" filter still set to "2010," change the "Month" filter to select "June". Having drilled down this far, you can see the individual prices for each day in the month of June. What is the close price of the stock on June 22, 2010? (Hint: Hover over the candlestick bars to see detailed stock price information on a particular day.) 5. Using the filter techniques you applied in question 4, did the stock price for Coca-Cola increase or decrease in value on the trading day of November 18, 2014? Complete this question by entering your answers in the tabs below. Reg 1 Req 2 Req3 Reg 4 Req 5 Based on the market capitalization chart, have companies increased or decreased in size over the life of the Dow Jones stock market index? Increased Decreased Complete this question by entering your answers in the tabs below. Req 1 Req 2 Req3 Req 4 Req 5 Which of the following statements is true about the data shown in the market capitalization chart? (Hint: You will need to use the "Year" filter to select specific time periods to answer this question.) On average, the size of companies listed in the Dow from 1929 to 1933 increased in size. Between 2008 and 2010, the Dow experienced a large increase in value as a result of booming economic conditions. The Dow experienced a large increase in value in the late 90s as a result of the technology boom. None of these choices are true. Complete this question by entering your answers in the tabs below. Req 1 Reg 2 Reg 3 Req 4 Req 5 Use the "Company filter to the right of the candlestick chart to select "McDonald's" from the dropdown list. Now use the "Year" filter to select "2010" from the dropdown list to show stock prices for the entire year. Lastly, to drill down even further, use the "Month filter to select "April." Over the time period shown, has McDonald's stock price increased or decreased over time? Show less A Increased Decreased Complete this question by entering your answers in the tabs below. Reg 1 Req 2 Reg 3 Req 4 Reg 5 With the "Company" filter still selected on "McDonald's" and the "Year" filter still set to "2010," change the "Month" filter to select "June". Having drilled down this far, you can see the individual prices for each day in the month of June. What is the close price of the stock on June 22, 2010? (Hint: Hover over the candlestick bars to see detailed stock price information on a particular day.) Show less A $70.01 O$70.37 O$68.55 $68.64 Complete this question by entering your answers in the tabs below. Req 1 Req 2 Req 3 Req 4 Req 5 Using the filter techniques you applied in question 4, did the stock price for Coca-Cola increase or decrease in value on the trading day of November 18, 2014? O Increase O Decrease Use the information from the Tableau dashboard to answer the following questions. Year Companies on the DOW Jones (Market Cap) (AII) 5B Company AIG 4B Alcoa Average daily market capitalization ($K) American Can American Express American Smelting American Sugar American Tobacco Anaconda Copper AT&T AT&T(SBC) Atlantic Refining Bank of America 2B 1B Bethlehem Steel OB 1934 1944 1954 1964 1974 1984 1994 2004 2014 Boeing Borden Stock Prices 100 200 300 400 6/23/96 2/28/97 11/5/97 7/13/98 3/20/99 11/25/99 8/1/00 4/8/01 12/14/01 8/21/02 4/28/03 1/3/04 9/9/04 5/17/05 1/22/06 9/29/06 6/6/07 2/11/08 10/18/08 6/25/09 3/2/10 11/7/10 7/15/11 3/21/12 11/26/12 8/3/13 4/10/14 12/16/14 8/23/15 4/29/16 Candlestick Chart: All o 200 400 600 800 Avg. Open (All) Month (All) Year (All) Company 1. Based on the market capitalization chart, have companies increased or decreased in size over the life of the DOW Jones stock market index? 2. Which of the following statements is true about the data shown in the market capitalization chart? (Hint: You will need to use the "Year filter to select specific time periods to answer this question.) 3. Use the "Company" filter to the right of the candlestick chart to select "McDonald's" from the dropdown list. Now use the "Year" filter to select "2010" from the dropdown list to show stock prices for the entire year. Lastly, to drill down even further, use the "Month" filter to select "April." Over the time period shown, has McDonald's stock price increased or decreased over time? 4. With the "Company" filter still selected on McDonald's" and the "Year" filter still set to "2010," change the "Month" filter to select "June". Having drilled down this far, you can see the individual prices for each day in the month of June. What is the close price of the stock on June 22, 2010? (Hint: Hover over the candlestick bars to see detailed stock price information on a particular day.) 5. Using the filter techniques you applied in question 4, did the stock price for Coca-Cola increase or decrease in value on the trading day of November 18, 2014? Complete this question by entering your answers in the tabs below. Reg 1 Req 2 Req3 Reg 4 Req 5 Based on the market capitalization chart, have companies increased or decreased in size over the life of the Dow Jones stock market index? Increased Decreased Complete this question by entering your answers in the tabs below. Req 1 Req 2 Req3 Req 4 Req 5 Which of the following statements is true about the data shown in the market capitalization chart? (Hint: You will need to use the "Year" filter to select specific time periods to answer this question.) On average, the size of companies listed in the Dow from 1929 to 1933 increased in size. Between 2008 and 2010, the Dow experienced a large increase in value as a result of booming economic conditions. The Dow experienced a large increase in value in the late 90s as a result of the technology boom. None of these choices are true. Complete this question by entering your answers in the tabs below. Req 1 Reg 2 Reg 3 Req 4 Req 5 Use the "Company filter to the right of the candlestick chart to select "McDonald's" from the dropdown list. Now use the "Year" filter to select "2010" from the dropdown list to show stock prices for the entire year. Lastly, to drill down even further, use the "Month filter to select "April." Over the time period shown, has McDonald's stock price increased or decreased over time? Show less A Increased Decreased Complete this question by entering your answers in the tabs below. Reg 1 Req 2 Reg 3 Req 4 Reg 5 With the "Company" filter still selected on "McDonald's" and the "Year" filter still set to "2010," change the "Month" filter to select "June". Having drilled down this far, you can see the individual prices for each day in the month of June. What is the close price of the stock on June 22, 2010? (Hint: Hover over the candlestick bars to see detailed stock price information on a particular day.) Show less A $70.01 O$70.37 O$68.55 $68.64 Complete this question by entering your answers in the tabs below. Req 1 Req 2 Req 3 Req 4 Req 5 Using the filter techniques you applied in question 4, did the stock price for Coca-Cola increase or decrease in value on the trading day of November 18, 2014? O Increase O Decrease
Step by Step Solution
There are 3 Steps involved in it

Get step-by-step solutions from verified subject matter experts