

Question: Use the information from your Cash flow statement to perform a Discounted Cash Flow valuation of your organisation Attempt to value the shares of your

Use the information from your Cash flow statement to perform a Discounted Cash Flow valuation of your organisation Attempt to value the shares of your company at the beginning of the 3-year period. .Assume the company has a cost of capital of 5 %. ( show these calculations in Excel)
Based on your DCF valuation answer the following questions for your typed report.
4)How does your valuation compare to the market price existing at the beginning of the 3-year period. Explain if and why your answer is the same / different
I have the 3 year period in the pictures I've attached. Please follow the link in comment for the cash flow for Genesis.
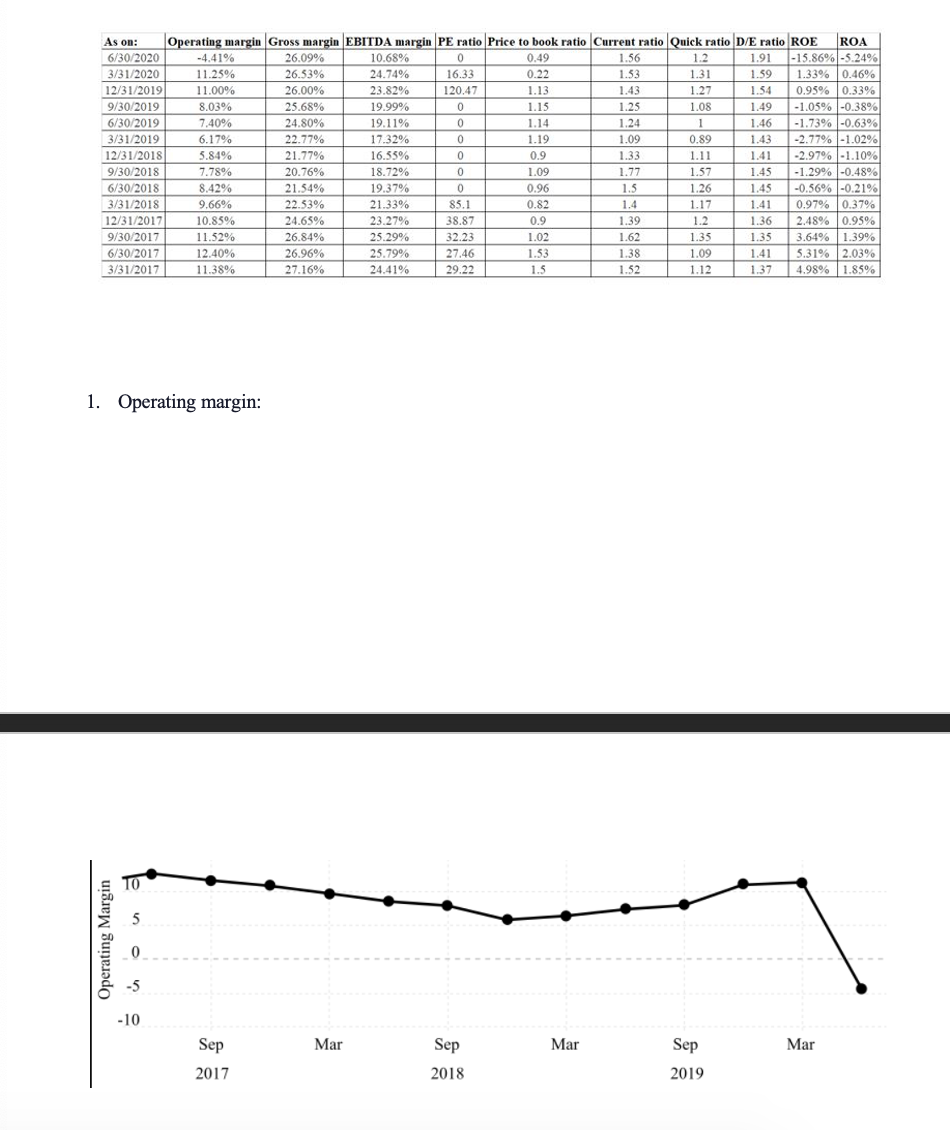
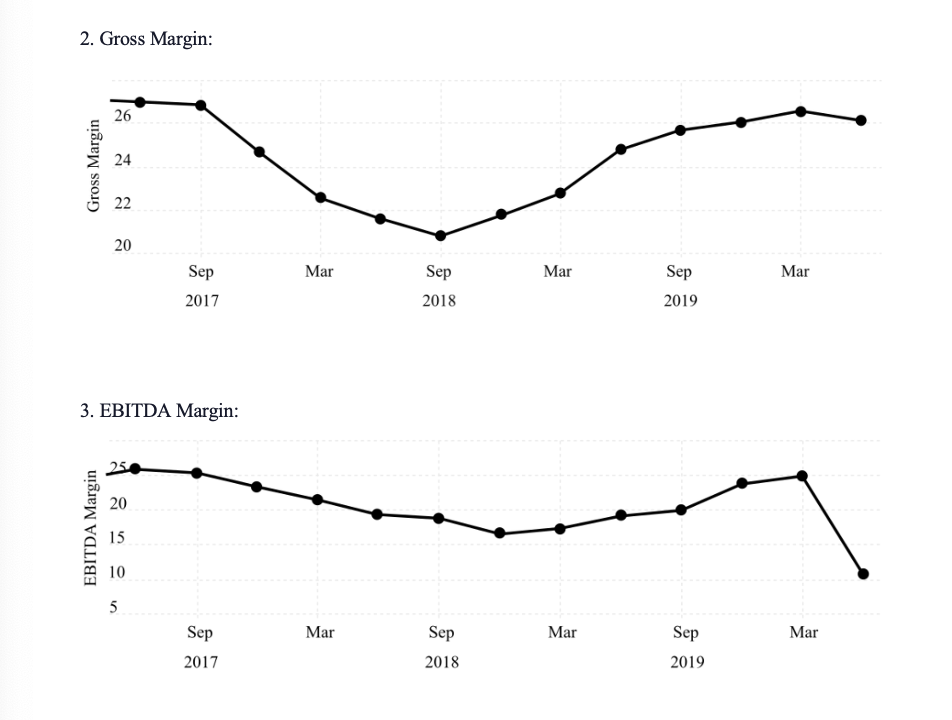


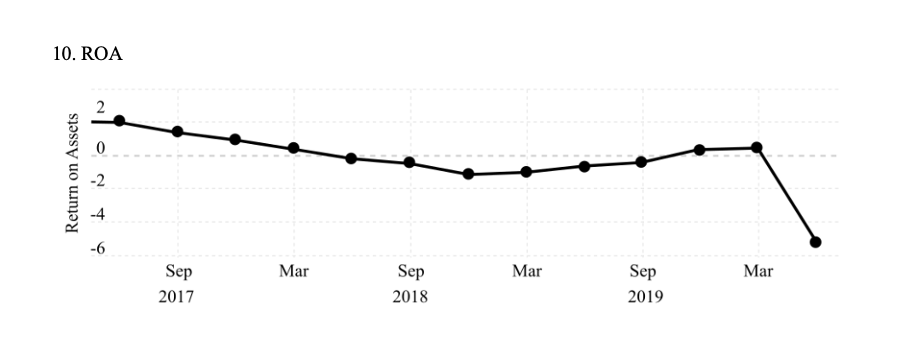

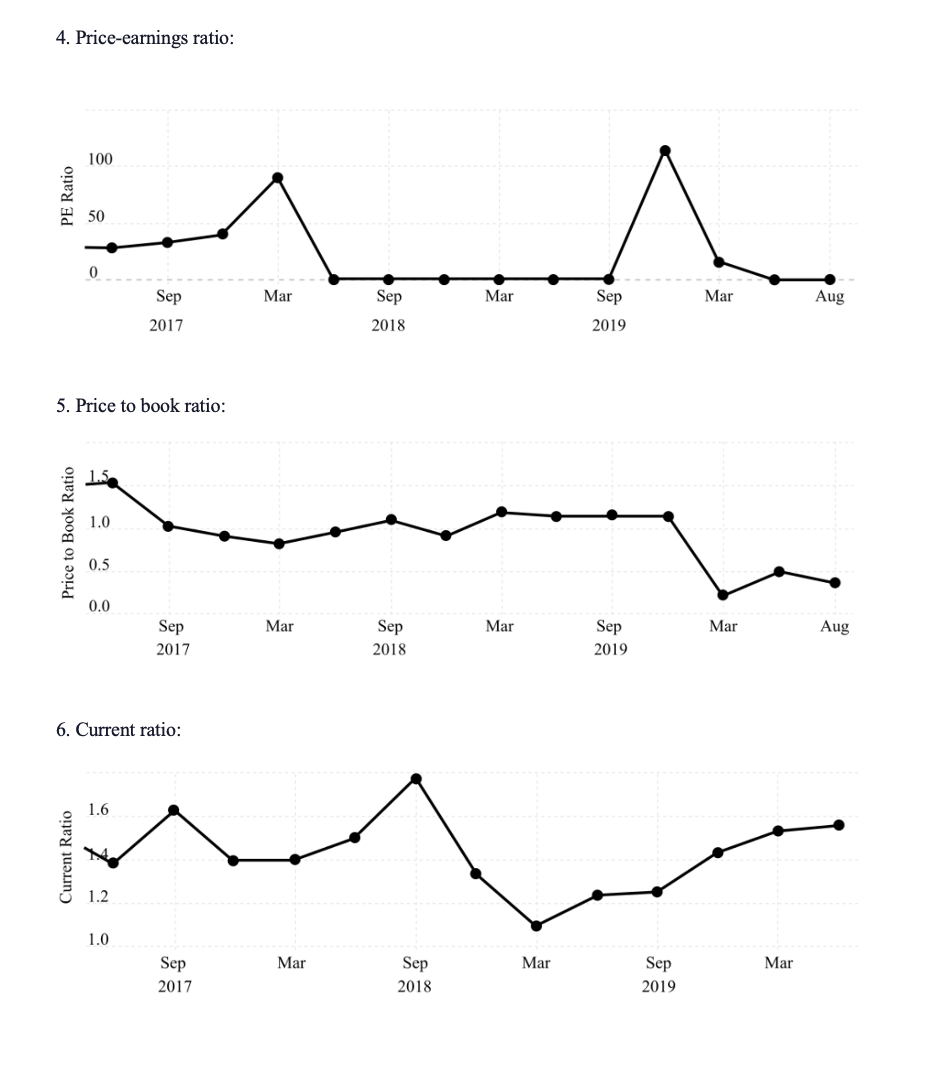
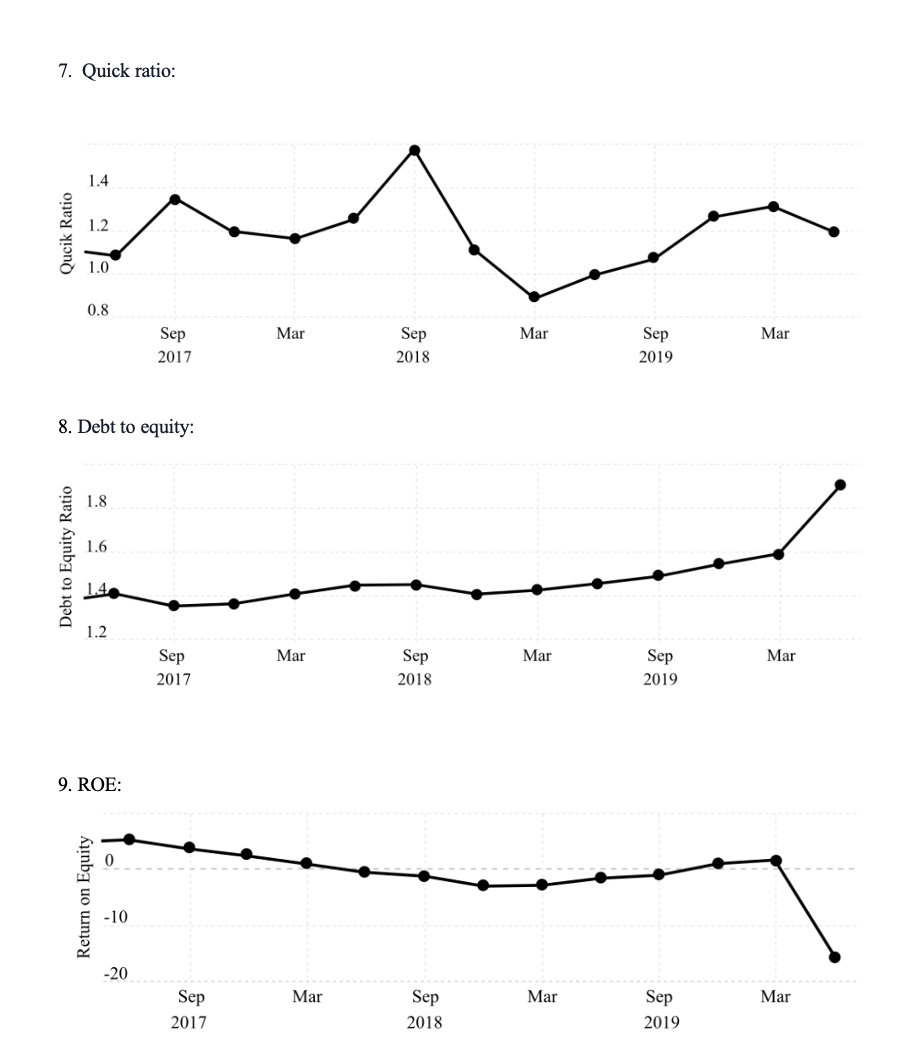
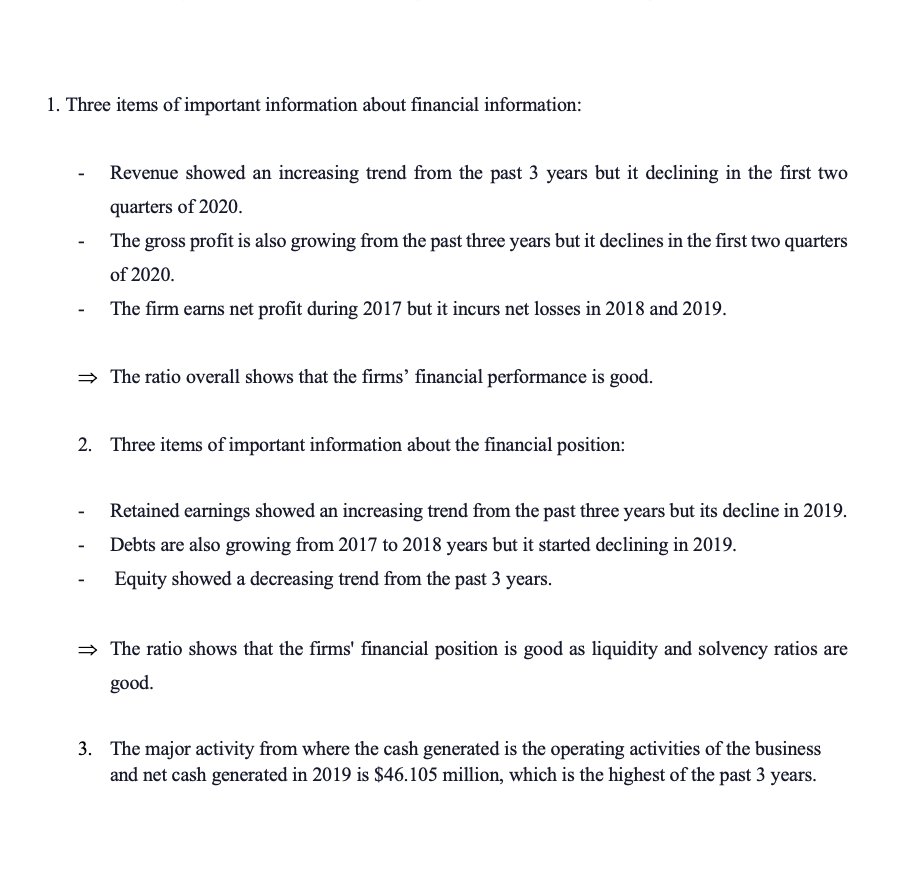
As on: 6/30/2020 Operating margin Gross margin EBITDA margin PE ratio Price to book ratio Current ratio Quick ratio D/E ratio ROE ROA -4.41% 26.09% 10.68% 0.49 3/31/2020 1.25% 1.56 1.2 1.91 -15.86% -5.24% 12/31/2019 26.53% 1.00% 24.74% 16.33 0.22 26.00% 23.82% 1.53 120.47 1.31 1.59 1.33% 0.46% 9/30/2019 1.13 1.43 8.03% 25.68% 19.99% 1.27 1.54 0.95% 0.33% 6/30/2019 7.40% 1.15 19.11% 1.25 1.08 3/31/2019 24.80% 1.14 6.17% 1.24 22.77% 1 1.49 -1.05% -0.38% 1.46 -1.73% -0.63% 12/31/2018 17.32% 1.19 5.84% 1.09 0.89 16.55% 1.43 -2.77% -1.02% 9/30/2018 21.77% 7.78% 20.76% 0.9 6/30/2018 18.72% 8.42% 1.09 1.33 1.11 1.77 1.41 -2.97% -1.10% 1.57 3/31/2018 21.54% 19.37% 9.66% 0.96 22.53% 1.5 1.45 -1.29% -0.48% 1.26 1.45 -0.56% -0.21% 12/31/2017 21.33% 85.1 0.82 1.4 1.39 1.17 9/30/2017 10.85% 24.65% 23.27%% 38.87 0.9 1.2 1.41 0.97% 0.37% 1.36 2.48% 0.95% 6/30/2017 1.52% 26.84% 12.40% 25.29% 32.23 26.96% 25.790 1.62 3/31/2017 11.38% 27.16% 27.46 1.02 24.41% 29.22 1.53 1.5 1.38 1.35 1.35 3.64% 1.39% 1.52 1.09 1 .12 1.41 1.37 5.31% 2.03% 4.98% 1.85% 1. Operating margin: Operating Margin TO in -10 Sep Mar Sep Mar Sep Mar 2017 2018 2019\f4. Price-earnings ratio: 100 PE Ratio 0 Mar Sep Mar Sep Mar Sep Aug 2018 2019 2017 5. Price to book ratio: Price to Book Ratio 1.0 0.5 0.0 Mar Aug Sep Mar Sep Mar Sep 2018 2019 2017 6. Current ratio: Current Ratio 1.6 1.2 1.0 Mar Sep Mar Sep Mar Sep 2019 2017 20187. Quick ratio: 1.4 Qucik Ratio 1.2 1.0 0.8 Sep Mar Sep Mar Sep Mar 2019 2017 2018 8. Debt to equity: Debt to Equity Ratio 1.8 1.6 1.4 1.2 Sep Mar Sep Mar Sep Mar 2018 2019 2017 9. ROE: Return on Equity 0 10 -20 Sep Mar Sep Mar Mar Sep 2019 2017 2018\f1. Three items of important information about financial information: Revenue showed an increasing trend from the past 3 years but it declining in the first two quarters of 2020. The gross profit is also growing from the past three years but it declines in the first two quarters of 2020. - The firm earns net profit during 2017 but it incurs net losses in 2018 and 2019. => The ratio overall shows that the firms' financial performance is good. 2. Three items of important information about the financial position: Retained earnings showed an increasing trend from the past three years but its decline in 2019. Debts are also growing from 2017 to 2018 years but it started declining in 2019. Equity showed a decreasing trend from the past 3 years. => The ratio shows that the firms' financial position is good as liquidity and solvency ratios are good. 3. The major activity from where the cash generated is the operating activities of the business and net cash generated in 2019 is $46.105 million, which is the highest of the past 3 years
Step by Step Solution
There are 3 Steps involved in it

Get step-by-step solutions from verified subject matter experts