

Question: Use the information in the Table 1 to analyze aggregate expenditures (AE) model below (Figure 1. Equilibrium in a Private Closed Economy). Figure 1. Equilibrium
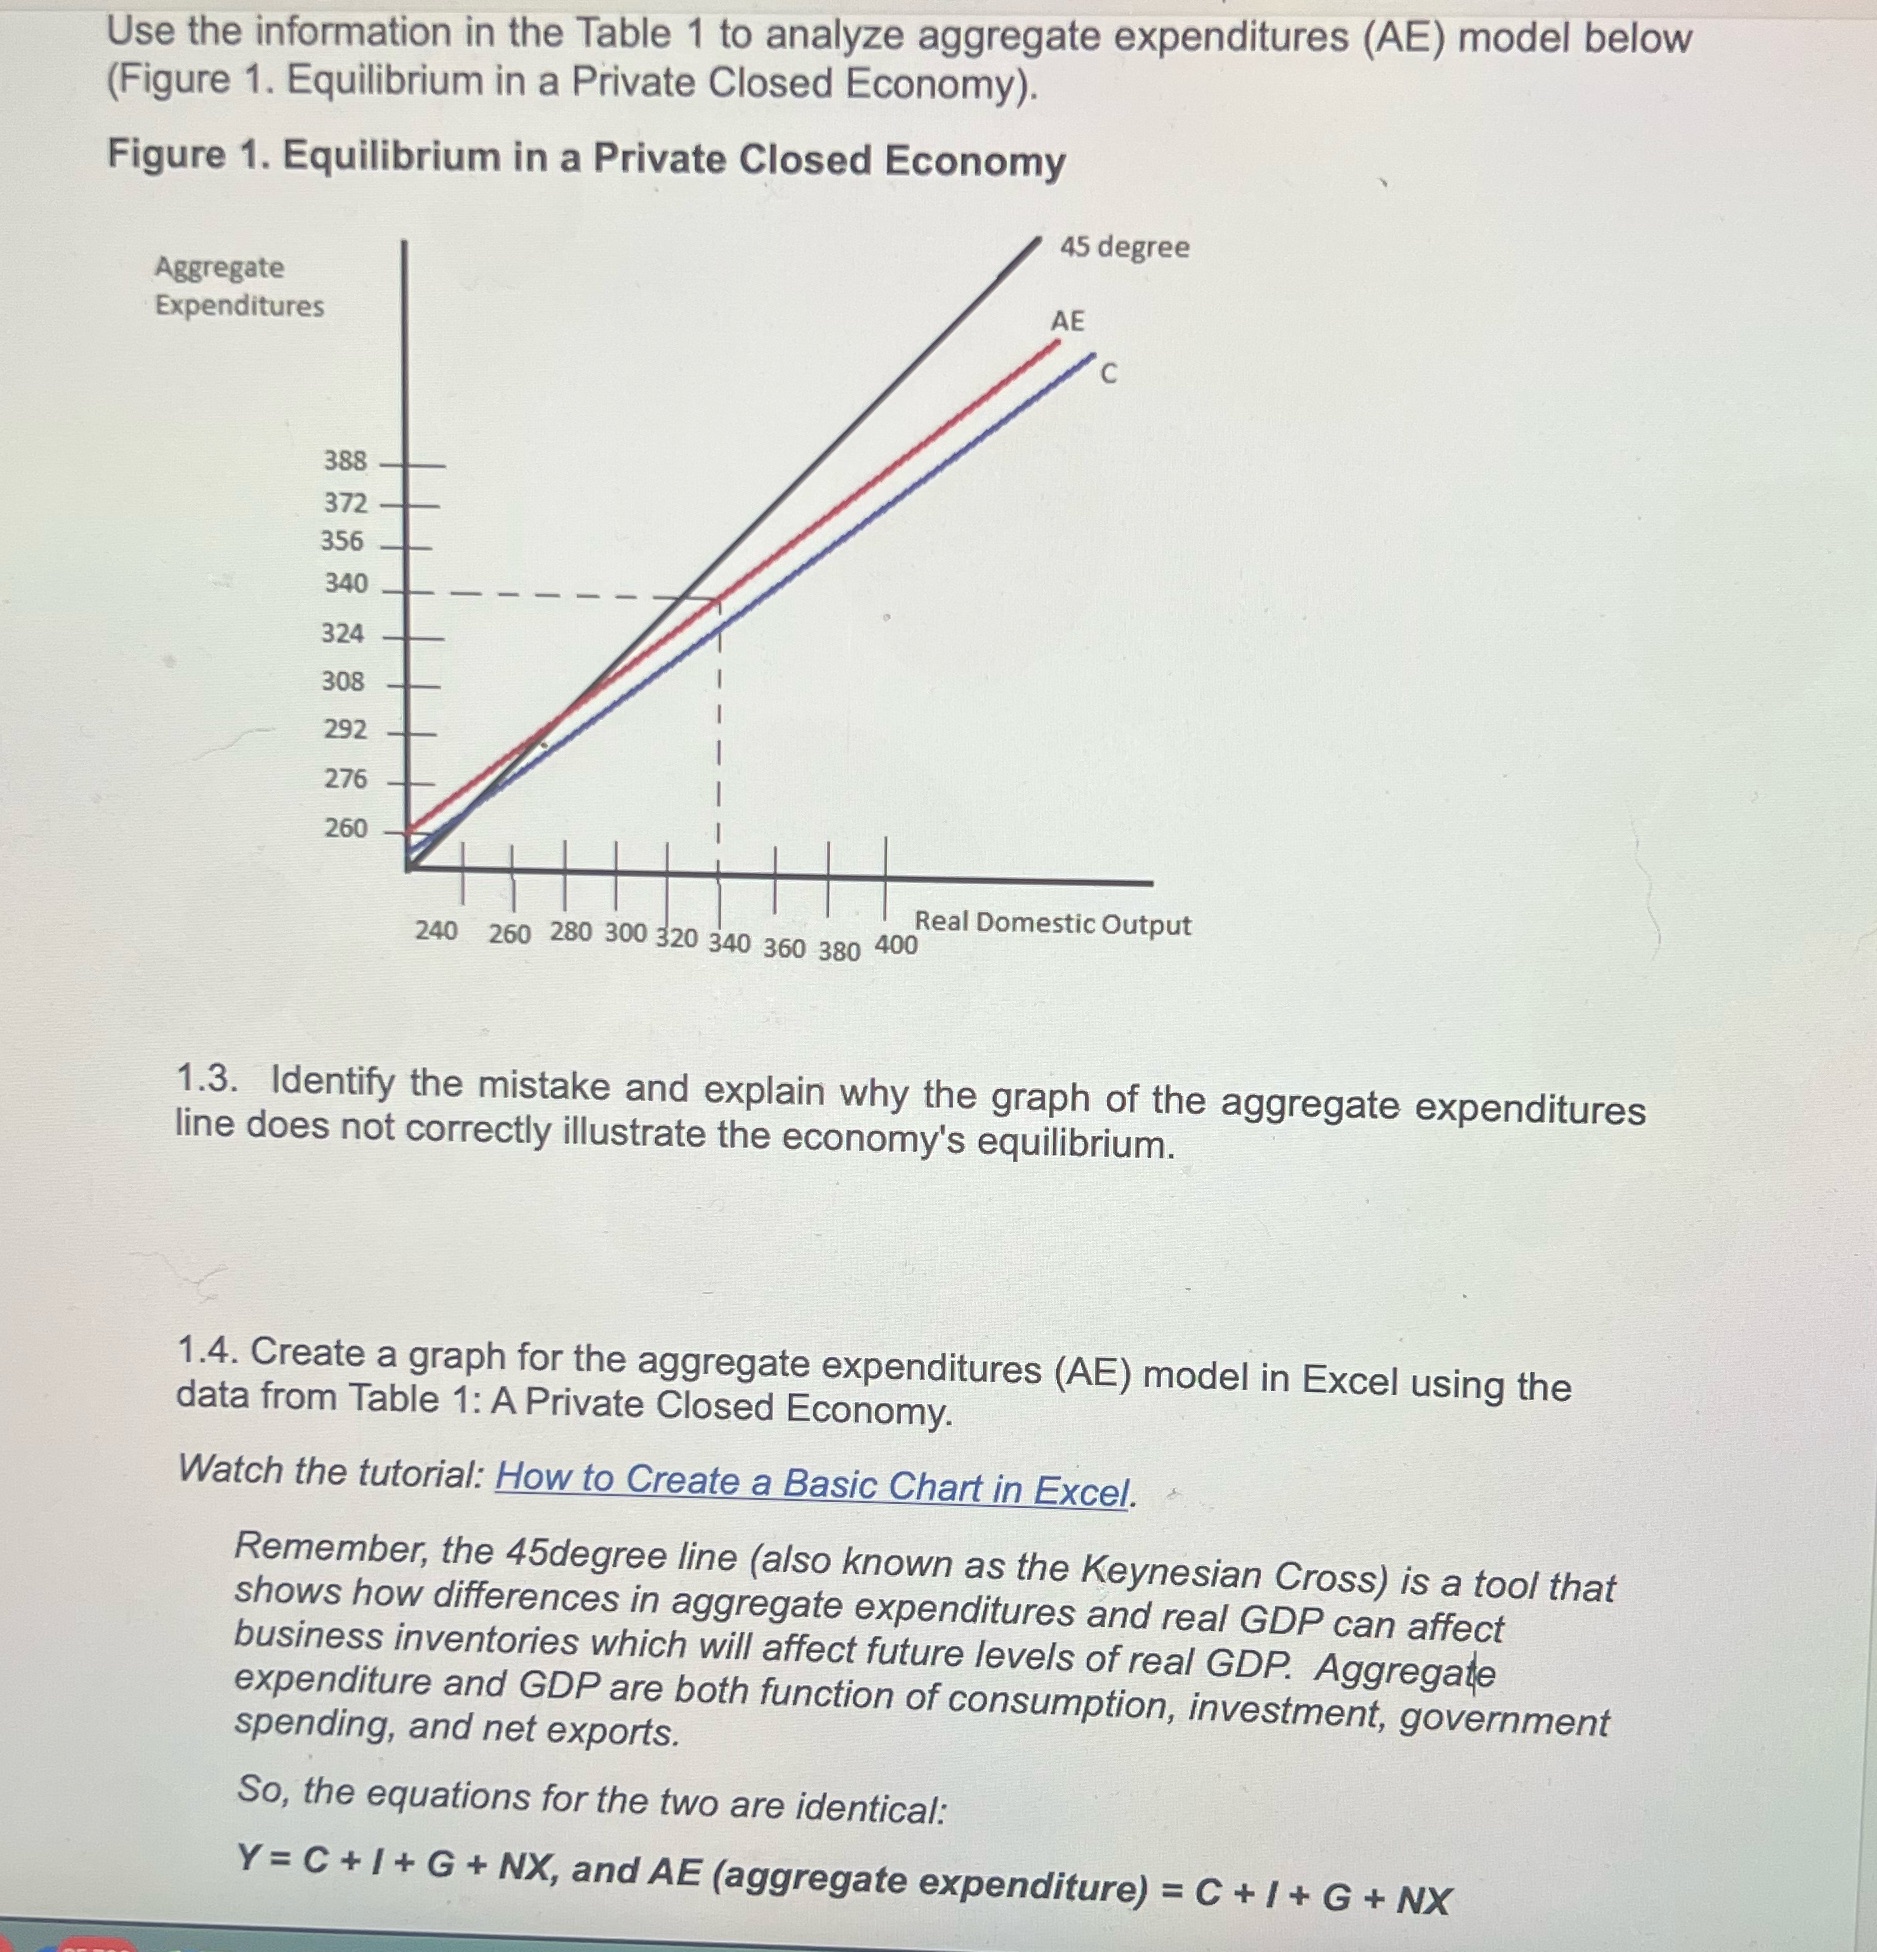
Use the information in the Table 1 to analyze aggregate expenditures (AE) model below (Figure 1. Equilibrium in a Private Closed Economy). Figure 1. Equilibrium in a Private Closed Economy 45 degree Aggregate Expenditures AE Real Domestic Out ut 240 260 2303(1) 20340 360 330400 p 1.3. Identify the mistake and explain why the graph of the aggregate expenditures line does not correctly illustrate the economy's equilibrium. 1.4. Create a graph for the aggregate expenditures (AE) model in Excel using the data from Table 1:A Private Closed Economy. Watch the tutorial: How to Create a Basic Chart in Excel. KR Remember, the 45degree line (also known as the Keynesian Cross) is a tool that shows how differences in aggregate expenditures and real GDP can affect busrness inventories which will affect future levels of real GDP. Aggregate expenditure and GDP are both function of consumption, investment, government spending, and net exports. So, the equations for the two are identical: Y= C + I + G + NX, and AE (aggregate expenditure} = C + l + G + NX _
Step by Step Solution
There are 3 Steps involved in it

Get step-by-step solutions from verified subject matter experts