

Question: Use the information in the table and graph to answer the question. Cash Flow Year Project 1 Project 2 0 -$22 -$47 1 $9 $20
Use the information in the table and graph to answer the question.
| Cash Flow | ||
| Year | Project 1 | Project 2 |
| 0 | -$22 | -$47 |
| 1 | $9 | $20 |
| 2 | $12 | $20 |
| 3 | $11 | $25 |
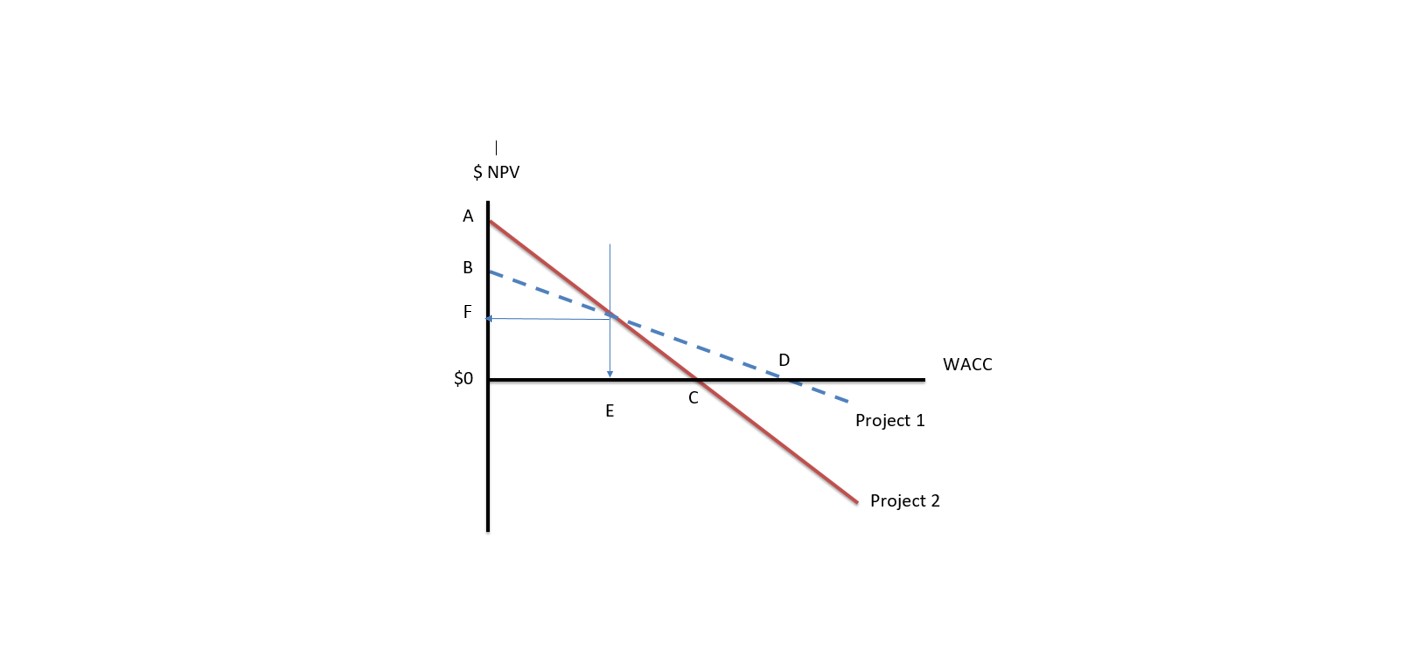
If the WACC for this firm is 16%, should the firm choose project 1 or project 2?
| Project 1 because it has a higher NPV. |
| Project 2 because it has a higher NPV |
| Project 2 because it has a higher IRR |
| Project 1 because it has a higher IRR |
SaveSaveSaveSave
$ NPV WACC $0 Project 1 Project 2
Step by Step Solution
There are 3 Steps involved in it
1 Expert Approved Answer
Step: 1 Unlock

Question Has Been Solved by an Expert!
Get step-by-step solutions from verified subject matter experts
Step: 2 Unlock
Step: 3 Unlock