

Question: Use the matlap and write the graph and the scribt : The impulse response of a linear time invariant system is given by h (
Use the matlap and write the graph and the scribt :
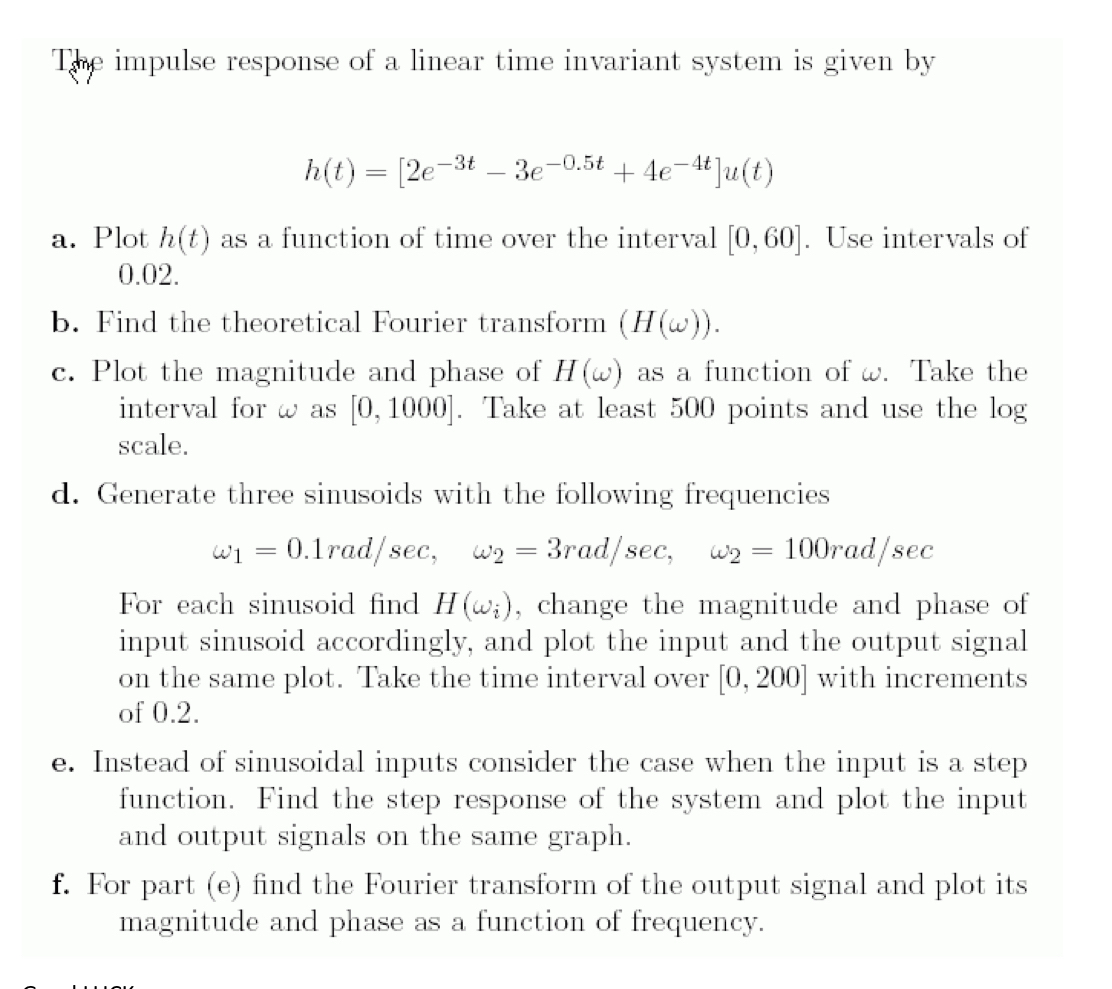
The impulse response of a linear time invariant system is given by
a Plot as a function of time over the interval Use intervals of
b Find the theoretical Fourier transform
c Plot the magnitude and phase of as a function of Take the interval for as Take at least points and use the scale.
d Generate three sinusoids with the following frequencies
For each sinusoid find change the magnitude and phase of input sinusoid accordingly, and plot the input and the output signal on the same plot. Take the time interval over with increments of
e Instead of sinusoidal inputs consider the case when the input is a step function. Find the step response of the system and plot the input and output signals on the same graph.
f For part e find the Fourier transform of the output signal and plot its magnitude and phase as a function of frequency.
Step by Step Solution
There are 3 Steps involved in it
1 Expert Approved Answer
Step: 1 Unlock

Question Has Been Solved by an Expert!
Get step-by-step solutions from verified subject matter experts
Step: 2 Unlock
Step: 3 Unlock