

Question: Use the mean, standard deviation, range and interquartile range (Compute as Q 3 -Q 1 ) presented in the STATISTICS table to describe the ages
Use the mean, standard deviation, range and interquartile range (Compute as Q3-Q1) presented in the STATISTICS table to describe the ages of sample members.
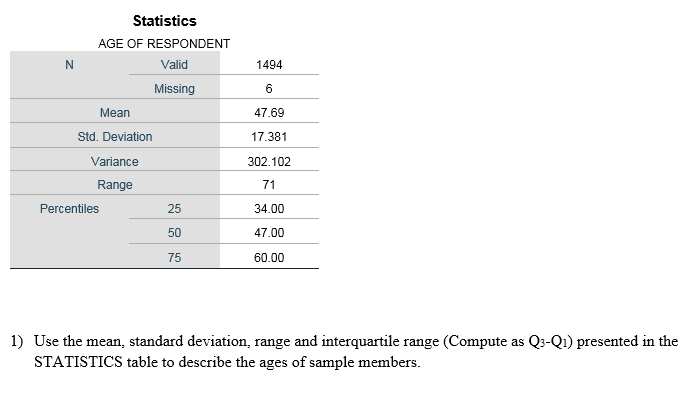
Statistics AGE OF RESPONDENT N Valid 1494 Missing 6 Mean 47.69 Std. Deviation 17.381 Variance 302.102 Range 71 Percentiles 25 34.00 50 47.00 75 60.00 1) Use the mean, standard deviation, range and interquartile range (Compute as Q3-Q1) presented in the STATISTICS table to describe the ages of sample members
Step by Step Solution
There are 3 Steps involved in it
1 Expert Approved Answer
Step: 1 Unlock

Question Has Been Solved by an Expert!
Get step-by-step solutions from verified subject matter experts
Step: 2 Unlock
Step: 3 Unlock