

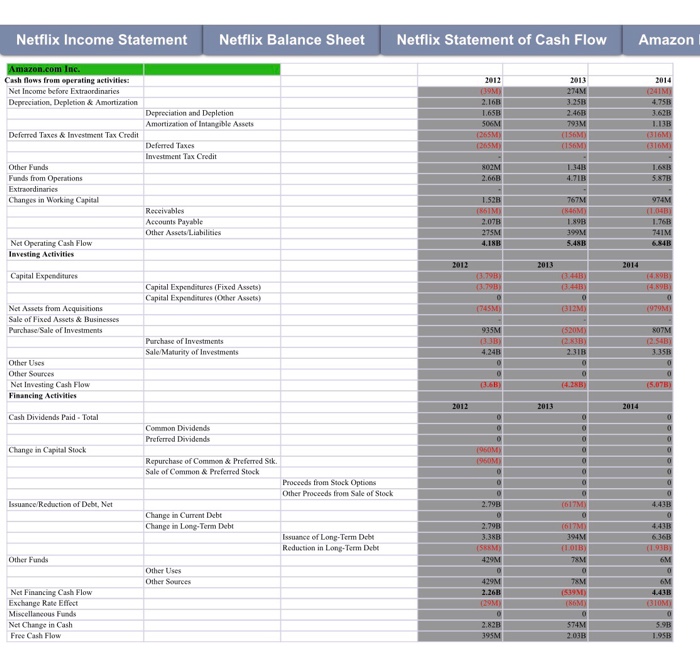
Question: Use the Netflix and Amazon Data Spreadsheet, located in the attached files (pictures) to generate a pro forma forecast and consider what this indicates about
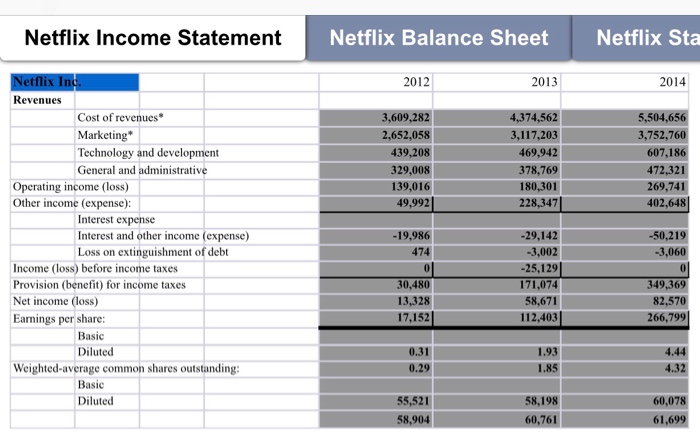
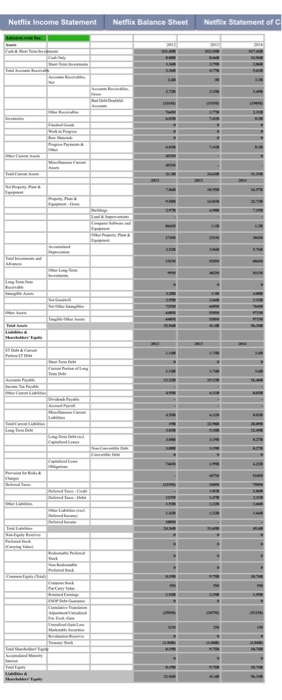
Netflix Income StatementN Netflix Balance Sheet Netflix Sta 2012 2013 2014 Netflix ln Revenues Cost of revenues Marketing Technology and development General and administrative 2,652,058 439,208 329,008 139,016 3,117,203 469,942 378,769 180,301 228,347 3,752,76 607,186 472,321 269,741 402,648 Operating income (loss) Other income (expense): Interest expense Interest and other income (expense) Loss on extinguishment of debt -19,986 474 50,219 3,060 Income (loss) before income taxes Provision (benefit) for income taxes Net income (loss) Earnings per share -29,142 3,002 25,129 171,074 58,671 112,403 30,480 13,328 17,152 349,369 82,570 266,799 Basic Diluted 0.31 0.29 1.93 1.85 4.44 4.32 Weighted-average common shares outstanding: Basic Diluted 58,198 60,761 60,078 55,521 904 61,6 Netflix Income StatementN Netflix Balance Sheet Netflix Sta 2012 2013 2014 Netflix ln Revenues Cost of revenues Marketing Technology and development General and administrative 2,652,058 439,208 329,008 139,016 3,117,203 469,942 378,769 180,301 228,347 3,752,76 607,186 472,321 269,741 402,648 Operating income (loss) Other income (expense): Interest expense Interest and other income (expense) Loss on extinguishment of debt -19,986 474 50,219 3,060 Income (loss) before income taxes Provision (benefit) for income taxes Net income (loss) Earnings per share -29,142 3,002 25,129 171,074 58,671 112,403 30,480 13,328 17,152 349,369 82,570 266,799 Basic Diluted 0.31 0.29 1.93 1.85 4.44 4.32 Weighted-average common shares outstanding: Basic Diluted 58,198 60,761 60,078 55,521 904 61,6
Step by Step Solution
There are 3 Steps involved in it

Get step-by-step solutions from verified subject matter experts