

Question: Use the normal distribution for following data to generate 10 sets of sales projections (to find min and max, please use last year's growth rate
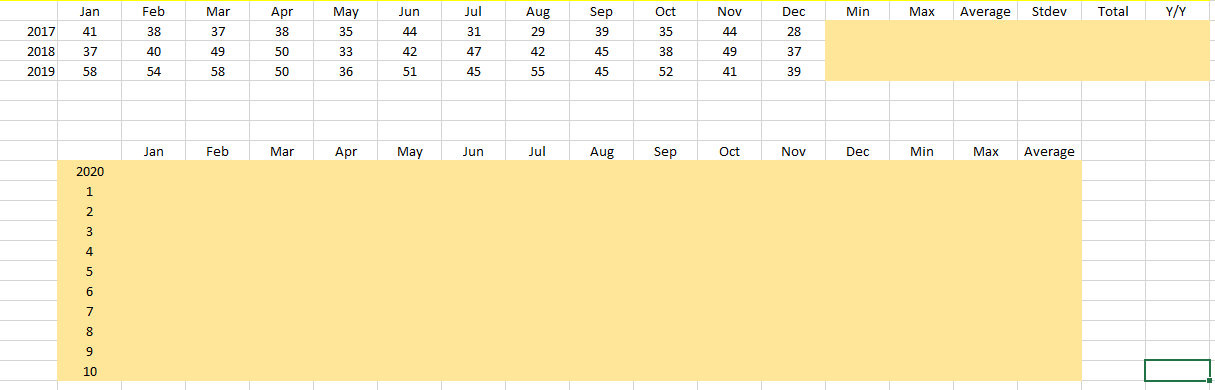 Use the normal distribution for following data to generate 10 sets of sales projections (to find min and max, please use last year's growth rate and use same Stdev of 2019) (Please show formulas)
Feb May Jun Min Max Average Stdev Total Y/Y Dec 28 38 2017 2018 2019 Jan 41 37 58 Jan Feb Mar Apr May Jun Jul Aug Sep Oct Nov Dec Min Max Average 2020 Feb May Jun Min Max Average Stdev Total Y/Y Dec 28 38 2017 2018 2019 Jan 41 37 58 Jan Feb Mar Apr May Jun Jul Aug Sep Oct Nov Dec Min Max Average 2020
Step by Step Solution
There are 3 Steps involved in it
1 Expert Approved Answer
Step: 1 Unlock

Question Has Been Solved by an Expert!
Get step-by-step solutions from verified subject matter experts
Step: 2 Unlock
Step: 3 Unlock