

Question: Use the NPV method to determine whether Preston Products should invest in the following projects: Project A costs $285,000 and offers seven annual net cash
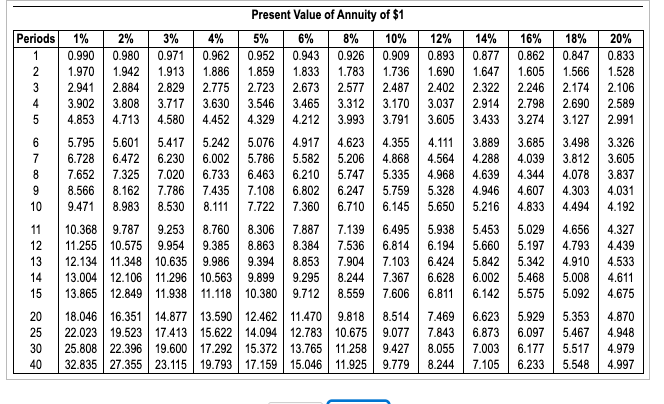
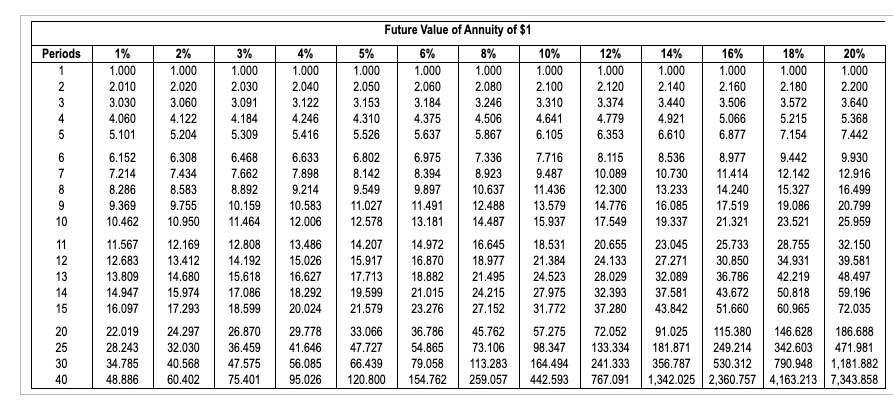
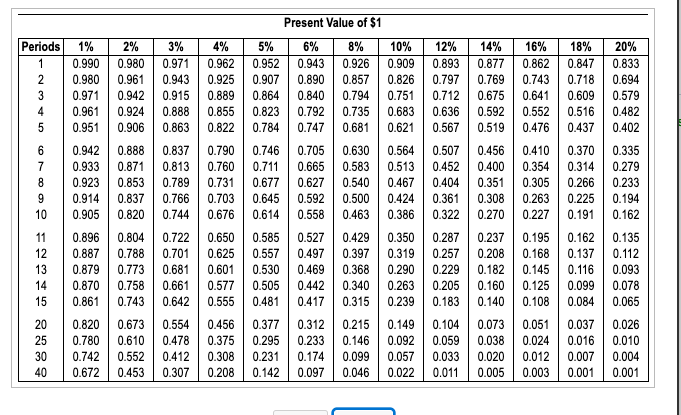
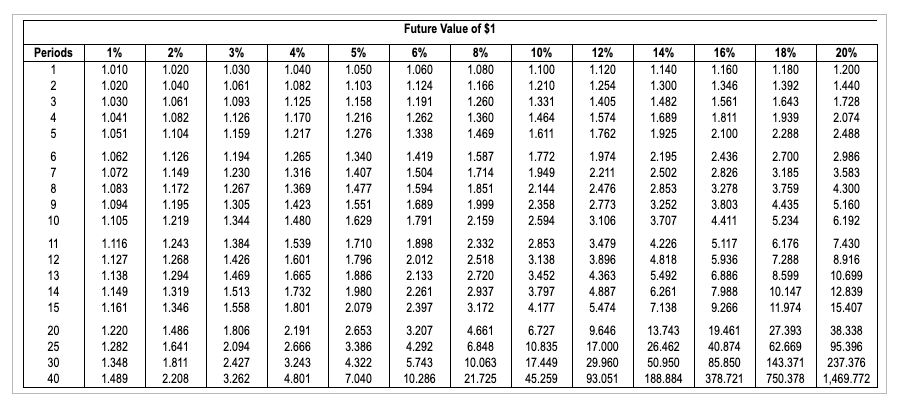
Use the NPV method to determine whether Preston Products should invest in the following projects: Project A costs $285,000 and offers seven annual net cash inflows of $59,000. Preston Products requires an annual return of 12% on projects like A. Project B costs $395,000 and offers ten annual net cash inflows of $67,000. Preston Products demands an annual return of 10% on investments of this nature. (Click the icon to view the present value annuity table.) / (Click the icon to view the present value table.) (Click the icon to view the future value annuity table.) (Click the icon to view the future value table.) Requirement What is the NPV of each project? What is the maximum acceptable price to pay for each project? Calculate the NPV of each project. (Round your answers to the nearest whole dollar. Use parentheses or a minus sign for negative net present values.) The NPV of Project A is $ Present Value of Annuity of $1 Periods | 1% 2% 3% 4% 5% 6% 8% 10% 12% 14% 0.990 0.980 0.971 0.962 0.952 0.943 0.926 0.909 0.893 0.877 1.970 1.942 1.9131.886 1.859 1.833 1.783 1.736 1.690 1.647 2.9412.884 | 2.829 2.775 2.723 2.673 2.577 2.487 2.402 2.322 3.902 3.808 3.717 3.630 | 3.546 3.465 3.312 3.170 3.037 2.914 4.853 4.713 4.580 4.452 4.329 4.212 | 3.993 3.791 3.605 3.433 5.601 5.417 5.242 5.076 4.917 4.623 4.355 4.111 3.889 6.728 6.472 6.230 6.002 5.786 5.582 5.206 4.868 4.564 4.288 7.652 7.325 7.020 6.733 6.463 6.210 5.747 5.335 4.968 4.639 8.566 8.162 7.786 7.435 7.108 6.802 6.247 5.759 5.328 4.946 9.471 8.983 8.530 8.111 7.722 6.710 6.145 5.650 5.216 10.368 9.787 9.253 8.760 8.306 7.887 7.139 6.495 5.938 5.453 11.255 10.575 9.954 9.385 8.863 8.384 7.536 6.814 6.194 5.660 12.134 | 11.348 10.635 9.986 | 9.394 8.853 7.904 7.103 6.424 5.842 13.004 12.106 | 11.296 | 10.563 9.899 9.295 8.244 7.367 6.628 6.002 13.865 12.849 11.938 11.118 10.380 9.712 8.559 7.606 6.811 6.142 18.046 16.351 14.877 13.590 12.462 | 11.470 9.818 8.514 7.4696.623 22.023 19.523 17.413 15.622 14.094 | 12.783 10.675 9.077 7.843 6.873 30 25.808 22.396 | 19.600 17.292 15.372 13.765 11.258 9.427 8.055 7.003 32.835 27.355 23.115 19.793 17.159 15.046 11.925 9.779 | 8.244 7.105 18% 0.847 1.566 2.174 2.690 3.127 3.498 3.812 4.078 4.303 4.494 5.795 16% 0.862 1.605 2.246 2.798 3.274 3.685 4.039 4.344 4.607 4.833 5.029 5.197 5.342 5.468 5.575 5.929 6.097 6.177 6.233 20% 0.833 1.528 2.106 2.589 2.991 3.326 3.605 3.837 4.031 4.192 7.360 4.327 4.656 4.793 4.910 5.008 5.092 5.353 5.467 5.517 5.548 4.439 4.533 4.611 4.675 4.870 4.948 4.979 4.997 Periods 2% 1.000 2.020 3.060 4.122 5.204 3% 1.000 2.030 3.091 4.184 5.309 6.468 7.662 8.892 10.159 11.464 4% 1.000 2.040 3.122 4.246 5.416 6.633 7.336 1% 1.000 2.010 3.030 4.060 5.101 6.152 7.214 8.286 9.369 10.462 11.567 12.683 13.809 14.947 16.097 22.019 28.243 34.785 48.886 7.898 6.308 7.434 8.583 9.755 10.950 12.169 13.412 14.680 15.974 17.293 24.297 32.030 40.568 60.402 Future Value of Annuity of $1 15% 6% 8% 10% 1.000 1.000 1.000 1.000 2.050 2.060 2.080 2.100 3.153 3.184 3.246 3.310 4.310 4.375 4.506 4.641 5.526 5.637 5.867 6.105 6.802 6.975 7.716 8.142 8.394 8.923 9.487 9.549 9.897 10.637 11.436 11.027 11.491 12.488 13.579 12.578 13.181 14.487 15.937 14.207 14.972 16.645 18.531 15.917 16.870 18.977 21.384 17.713 18.882 21.495 24.523 19.599 21.015 24.215 27.975 21.579 23.276 27.152 31.772 33.066 36.786 45.762 57.275 47.727 54.865 73.106 98.347 66.439 79.058 113.283 164.494 120.800 154.762259.057 442.593 9.214 10.583 12.006 13.486 15.026 16.627 18.292 20.024 29.778 41.646 56.085 95.026 12% 1.000 2.120 3.374 4.779 6.353 8.115 10.089 12.300 14.776 17.549 20.655 24.133 28.029 32.393 37.280 72.052 133.334 241.333 767.091 14% 1.000 2.140 3.440 4.921 6.610 8.536 10.730 13.233 16.085 19.337 23.045 27.271 32.089 37.581 43.842 91.025 181.871 356.787 1,342.025 16% 18% 20% 1.000 1.000 1.000 2. 160 2.180 2.200 3.506 3.572 3.640 5.066 5.215 5.368 6.877 7.154 7.442 8.977 9.442 9.930 11.414 12.142 12.916 14.240 15.327 16.499 17.519 19.086 20.799 21.321 23.521 25.959 25.733 28.755 32.150 30.850 34.931 39.581 36.786 42.219 48.497 43.672 50.818 59.196 51.660 60.965 115.380 146.628 186.688 249.214 342.603 471.981 530.312790.948 1,181.882 2,360.757 4,163.213 7,343.858 12.808 14.192 15.618 17.086 18.599 26.870 36.459 47.575 75.401 72.035 Present Value of $1 | Periods) 1% | 2% | 3% | 4% | 5% | 6% | 8% | 10% | 12% | 14% | 16% | 18% | 20%, 0.990 | 0.980 | 0.971 | 0.962 | 0.952 | 0.943 | 0.926 | 0.909 | 0.893 | 0.877 | 0.862 | 0.847 | 0.833 10.980 | 0.961 | 0.943 | 0.925 | 0.907 | 0.890 | 0.857 || | 0.826 | 0.797 | 0.769 | 0.743 0.718 | 0.694 0.971 | 0.942 | 0.915 | 0.889 | 0.864 | 0.840 || 10.794 10.751 | 0712 10.675 10.641 0.609 | 0.579 0.961 | 0.924 | 0.888 | 10.855 | 0.823 | 0792 0.735 | 0683 | 0.636 | 0.592 | 0.552 10.516 | 0.482 0.951 0.906 | 0.863 | 0.822 | 0.784 | 0.747 0.681 0621 | 0.567 | 0.519 | 0.476 10.437 | 0.402 0.942 10.888 | 0.837 | 0.790 | 0.746 | 0.705 0.630 10.564 | 0.507 | 0.456 | 0.410 | 0.370 | 0.335 0.933 0.871 0.813 | 10.760 | 0.711 | 0.665 0.583 10.513 | 0452 | | 0.400 | 0.354 | 0.314 | 0.279 0.923 0.853 10.789 | 0.731 | 0.677 | 0.627 0.540 | 10467 | 0.404 | 0.351 | 0.305 | 0.266 | 0.233 0.914 0.837 0.766 | 10.703 | 0.645 | 0.592 10.500 10.424 | 0.361 | 0.308 | 0.263 | 0.225 | 0.194 0.905 10.820 10.744 || 10.676 | | 0.614 | 0.558 10.463 0.386 | 0.322 | 0.270 | 0.227 | 0.191 | 0.162 0.896 0.804 10.722 | 10.650 | 0.585 | 0.527 0429 0.350 | 10.287 | 0.237 | 0.195 | 10.162 | 0.135 0.887 0.788 10.701 | 0.625 10.557 | 10.497 0.397 0.319 | 0.257 | 0.208 0.168 10.137 | 0.112 0.879 0.773 10.681 | | 0.601 0.530 10.469 0.368 0.290 | 0.229 | 0.182 0 145 lo | 10.116 | 0.093 0.870 0.758 | 0.61 | 0.577 10.505 | 0.442 0.340 0.263 0.205 | 0.160 0.125 | 0.099 | 0.078 0.861 10.743 10.642 | 0.555 | | 0.481 | | 0.417 0.315 0.239 | 0.183 | 0.140 10.108 | 0.084 | 0.065 0.820 | 0.673 | 0.554 | 0.456 | 0.377 | 0.312 0.215 0.149 | 0.104 | 0.073 0.051 | 0.037 | 0.026 0.780 | 0.610 | 0478 10.375 | 0.295 | 0.233 0.146 0.092 | 0.059 10.038 0.024 | 0.016 | 0.010 10.552 | 0.412 | 10.308 | 0.231 | 0.174 0.099 0.057 | 0.033 | 0.020 | 10.012 | 0.007 | 0.004 | 0672 10.453 10307 10208 10.142 10097 10046 10022 10.011 10.005 10.003 10001 10.001 0.742 Periods 8% 20% 4% 1.040 1.082 1.125 1.170 1.217 3% 1.030 1.061 1.093 1.126 1.159 1.194 1.230 1.267 1.305 1.344 5% 1.050 1.103 1.158 1.216 1.276 14% 1.140 1.300 1.482 1.689 1.925 2.195 2.502 1% 1.010 1.020 1.030 1.041 1.051 1.062 1.072 1.083 1.094 1.105 1.116 1.127 1.138 1.149 1.161 1.220 1.282 1.348 1.489 1.265 2% 1.020 1.040 1.061 1.082 1.104 1.126 1.149 1.172 1.195 1.219 1.243 1.268 1.294 1.319 1.346 1.486 1.641 1.811 2.208 2.853 16% 1.160 1.346 1.561 1.811 2.100 2.436 2.826 3.278 3.803 4.411 Future Value of $1 6% 1.060 1.080 1.124 1.166 1.191 1.260 1.262 1.360 1.338 1.469 1.419 1.587 1.504 1.714 1.594 1.851 1.689 1.999 1.791 2.159 1.898 2.332 2.012 2.518 2.133 2.720 2.261 2.937 2.397 3.172 3.207 4.661 4.292 6.848 5.743 10.063 10.286 21.725 18% 1.180 1.392 1.643 1.939 2.288 2.700 3.185 3.759 4.435 5.234 3.252 10% 1.100 1.210 1.331 1.464 1.611 1.772 1.949 2.144 2.358 2.594 2.853 3.138 3.452 3.797 4.177 6.727 10.835 17.449 45.259 12% 1.120 1.254 1.405 1.574 1.762 1.974 2.211 2.476 2.773 3.106 3.479 3.896 4.363 4.887 5.474 9.646 17.000 29.960 93.051 1.316 1.369 1.423 1.480 1.539 1.601 1.665 1.732 1.801 2.191 2.666 3.243 4.801 1.200 1.440 1.728 2.074 2.488 2.986 3.583 4.300 5.160 6.192 7.430 8.916 10.699 1.340 1.407 1.477 1.551 1.629 1.710 1.796 1.886 1.980 2.079 2.653 3.386 4.322 7.040 3.707 1.384 1.426 1.469 1.513 1.558 1.806 2.094 2.427 3.262 12.839 4.226 4.818 5.492 6.261 7.138 13.743 26.462 50.950 188.884 5.117 5.936 6.886 7.988 9.266 19.461 40.874 85.850 378.721 6.176 7.288 8.599 10.147 11.974 27.393 62.669 143.371 750.378 15.407 38.338 95.396 237.376 1,469.772
Step by Step Solution
There are 3 Steps involved in it

Get step-by-step solutions from verified subject matter experts