

Question: Use the operating projections for each projects to compute a net present value (NPV) for each. Which project creates more value? Please explain your rationale.
- Use the operating projections for each projects to compute a net present value (NPV) for each. Which project creates more value? Please explain your rationale.
- Compute the internal rate of return (IRR) and payback period for each project. How should these metrics affect Harris' deliberations? How do they compare to NPV as tools for evaluating projects? When and how would you use each?
- What additional information does Harris need to complete her analyses and compare the two projects? What specific questions should she ask each of the project sponsors?
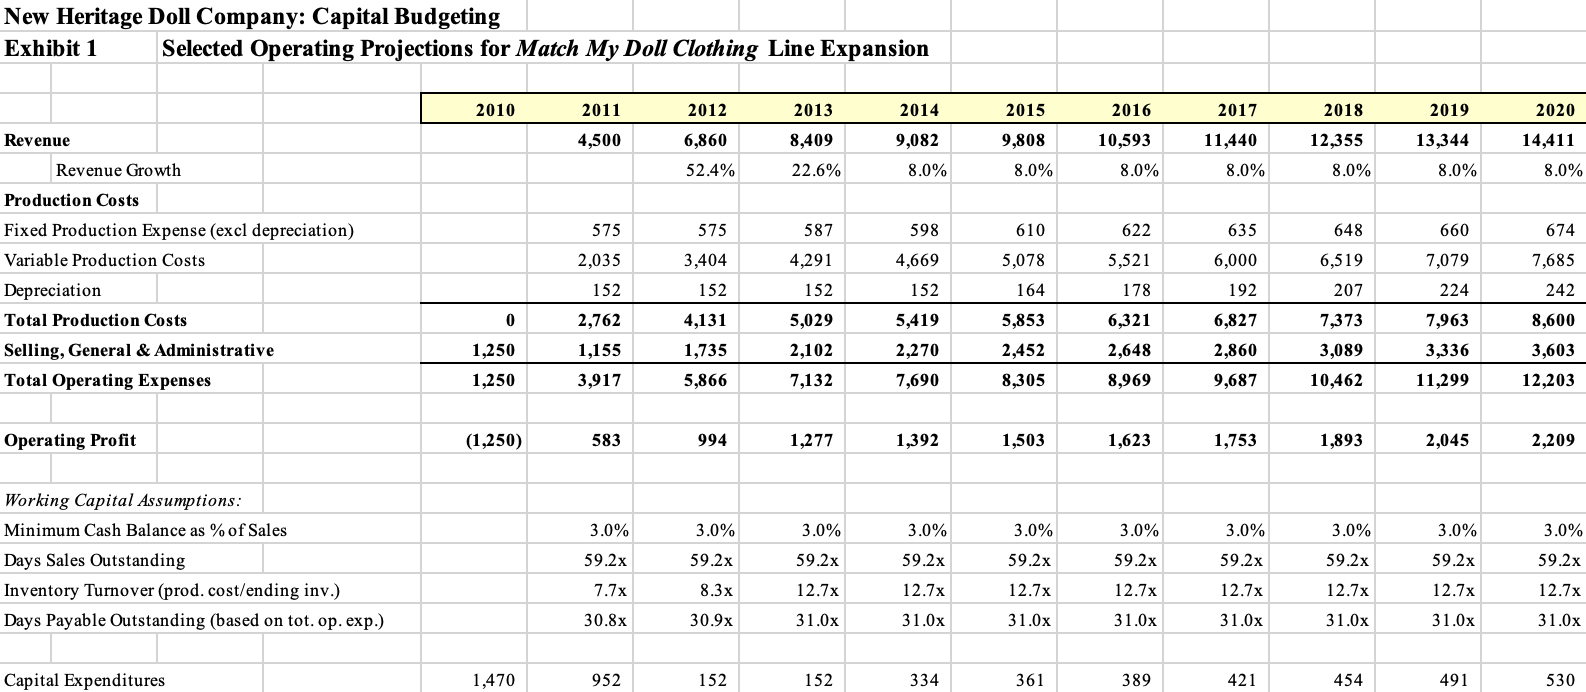
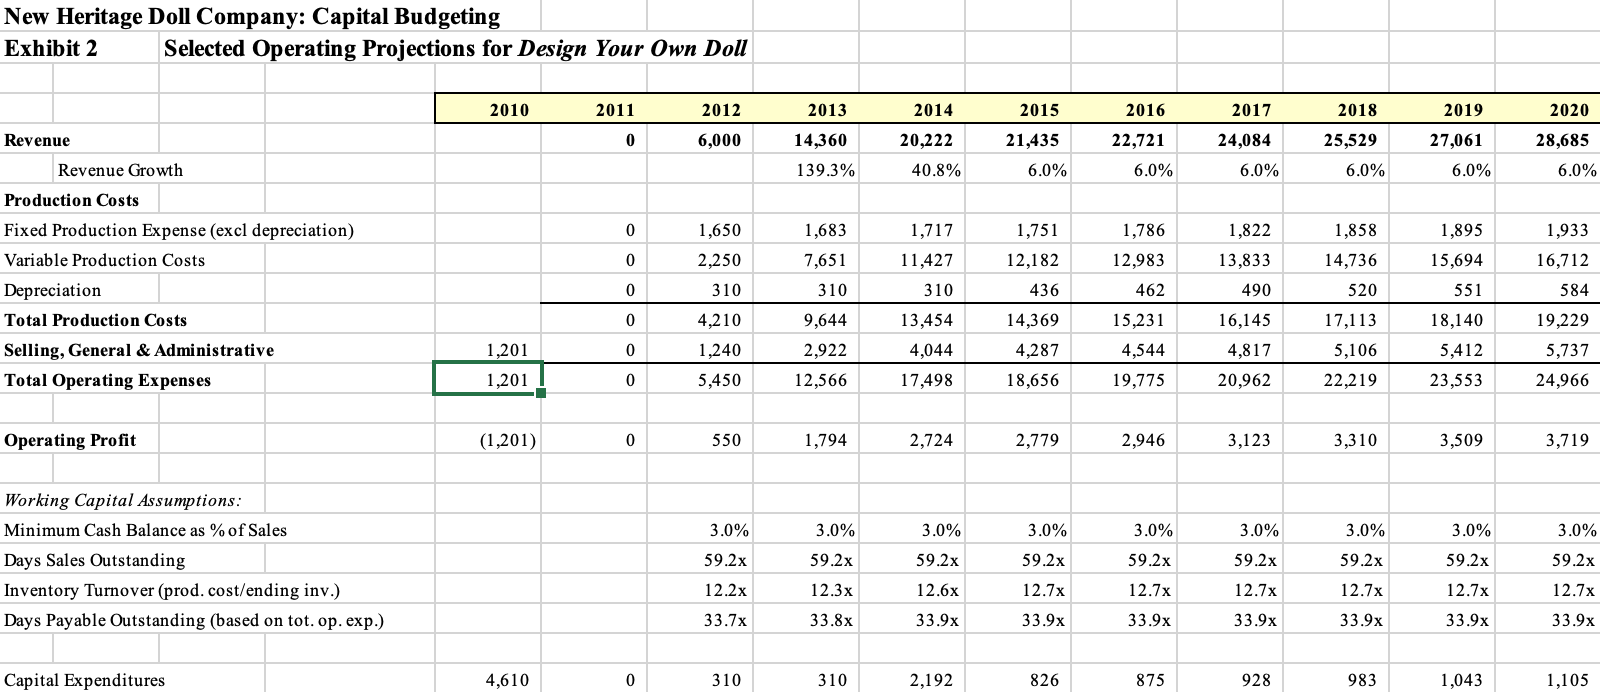
New Heritage Doll Company: Capital Budgeting Exhibit 1 Selected Operating Projections for Match My Doll Clothing Line Expansion 2010 2011 2012 2013 2014 2015 2016 2017 2018 2019 2020 Revenue 4,500 6,860 8,409 9,082 9,808 10,593 11,440 12,355 13,344 14,411 Revenue Growth 52.4% 22.6% 8.0% 8.0% 8.0% 8.0% 8.0% 8.0% 8.0% 575 575 587 598 610 622 635 648 660 674 2,035 3,404 4,291 4,669 5,078 5,521 6,000 6,519 7,079 Production Costs Fixed Production Expense (excl depreciation) Variable Production Costs Depreciation Total Production Costs Selling, General & Administrative Total Operating Expenses 7,685 242 152 152 152 152 164 178 192 207 224 0 2,762 4,131 5,029 5,419 5,853 6,321 6,827 7,373 7,963 8,600 3,603 1,250 1,155 1,735 2,102 2,270 2,452 2,648 2,860 3,089 3,336 1,250 3,917 5,866 7,132 7,690 8,305 8,969 9,687 10,462 11,299 12,203 Operating Profit (1,250) 583 994 1,277 1,392 1,503 1,623 1,753 1,893 2,045 2,209 3.0% 3.0% 3.0% 3.0% 3.0% 3.0% 3.0% 3.0% 3.0% 3.0% Working Capital Assumptions: Minimum Cash Balance as % of Sales Days Sales Outstanding Inventory Turnover (prod. cost/ending inv.) Days Payable Outstanding (based on tot. op. exp.) 59.2x 59.2x 59.2x 59.2x 59.2x 59.2x 59.2x 59.2x 59.2x 59.2x 7.7x 8.3x 12.7x 12.7x 12.7x 12.7x 12.7x 12.7x 12.7x 12.7x 30.8x 30.9x 31.0x 31.0x 31.0x 31.0x 31.0x 31.0x 31.0x 31.0x Capital Expenditures 1,470 952 152 152 334 361 389 421 454 491 530 New Heritage Doll Company: Capital Budgeting Exhibit 2 Selected Operating Projections for Design Your Own Doll 2010 2011 2012 2013 2014 2015 2016 2017 2018 2019 2020 Revenue 0 6,000 20,222 21,435 22,721 24,084 25,529 28,685 14,360 139.3% 27,061 6.0% Revenue Growth 40.8% 6.0% 6.0% 6.0% 6.0% 6.0% 0 1,650 1,683 1,822 1,858 1,895 1,933 1,717 11,427 1,751 12,182 0 2,250 7,651 1,786 12,983 462 13,833 Production Costs Fixed Production Expense (excl depreciation) Variable Production Costs Depreciation Total Production Costs Selling, General & Administrative Total Operating Expenses 16,712 14,736 520 15,694 551 0 310 310 310 436 490 584 0 9,644 16,145 4,210 1,240 13,454 4,044 14,369 4,287 15,231 4,544 17,113 5,106 18,140 5,412 19,229 5,737 1,201 0 2,922 4,817 1,201 0 5,450 12,566 17,498 18,656 19,775 20,962 22,219 23,553 24,966 Operating Profit (1,201) 0 550 1,794 2,724 2,779 2,946 3,123 3,310 3,509 3,719 3.0% 3.0% 3.0% 3.0% 3.0% 3.0% 3.0% 3.0% 3.0% Working Capital Assumptions: Minimum Cash Balance as % of Sales Days Sales Outstanding Inventory Turnover (prod. cost/ending inv.) Days Payable Outstanding (based on tot. op. exp.) 59.2x 59.2x 59.2x 59.2x 59.2x 59.2x 59.2x 59.2x 59.2x 12.2x 12.3x 12.6x 12.7x 12.7x 12.7x 12.7x 12.7x 12.7x 33.7x 33.8x 33.9x 33.9x 33.9x 33.9x 33.9x 33.9x 33.9x Capital Expenditures 4,610 0 310 310 2,192 826 875 928 983 1,043 1,105 New Heritage Doll Company: Capital Budgeting Exhibit 1 Selected Operating Projections for Match My Doll Clothing Line Expansion 2010 2011 2012 2013 2014 2015 2016 2017 2018 2019 2020 Revenue 4,500 6,860 8,409 9,082 9,808 10,593 11,440 12,355 13,344 14,411 Revenue Growth 52.4% 22.6% 8.0% 8.0% 8.0% 8.0% 8.0% 8.0% 8.0% 575 575 587 598 610 622 635 648 660 674 2,035 3,404 4,291 4,669 5,078 5,521 6,000 6,519 7,079 Production Costs Fixed Production Expense (excl depreciation) Variable Production Costs Depreciation Total Production Costs Selling, General & Administrative Total Operating Expenses 7,685 242 152 152 152 152 164 178 192 207 224 0 2,762 4,131 5,029 5,419 5,853 6,321 6,827 7,373 7,963 8,600 3,603 1,250 1,155 1,735 2,102 2,270 2,452 2,648 2,860 3,089 3,336 1,250 3,917 5,866 7,132 7,690 8,305 8,969 9,687 10,462 11,299 12,203 Operating Profit (1,250) 583 994 1,277 1,392 1,503 1,623 1,753 1,893 2,045 2,209 3.0% 3.0% 3.0% 3.0% 3.0% 3.0% 3.0% 3.0% 3.0% 3.0% Working Capital Assumptions: Minimum Cash Balance as % of Sales Days Sales Outstanding Inventory Turnover (prod. cost/ending inv.) Days Payable Outstanding (based on tot. op. exp.) 59.2x 59.2x 59.2x 59.2x 59.2x 59.2x 59.2x 59.2x 59.2x 59.2x 7.7x 8.3x 12.7x 12.7x 12.7x 12.7x 12.7x 12.7x 12.7x 12.7x 30.8x 30.9x 31.0x 31.0x 31.0x 31.0x 31.0x 31.0x 31.0x 31.0x Capital Expenditures 1,470 952 152 152 334 361 389 421 454 491 530 New Heritage Doll Company: Capital Budgeting Exhibit 2 Selected Operating Projections for Design Your Own Doll 2010 2011 2012 2013 2014 2015 2016 2017 2018 2019 2020 Revenue 0 6,000 20,222 21,435 22,721 24,084 25,529 28,685 14,360 139.3% 27,061 6.0% Revenue Growth 40.8% 6.0% 6.0% 6.0% 6.0% 6.0% 0 1,650 1,683 1,822 1,858 1,895 1,933 1,717 11,427 1,751 12,182 0 2,250 7,651 1,786 12,983 462 13,833 Production Costs Fixed Production Expense (excl depreciation) Variable Production Costs Depreciation Total Production Costs Selling, General & Administrative Total Operating Expenses 16,712 14,736 520 15,694 551 0 310 310 310 436 490 584 0 9,644 16,145 4,210 1,240 13,454 4,044 14,369 4,287 15,231 4,544 17,113 5,106 18,140 5,412 19,229 5,737 1,201 0 2,922 4,817 1,201 0 5,450 12,566 17,498 18,656 19,775 20,962 22,219 23,553 24,966 Operating Profit (1,201) 0 550 1,794 2,724 2,779 2,946 3,123 3,310 3,509 3,719 3.0% 3.0% 3.0% 3.0% 3.0% 3.0% 3.0% 3.0% 3.0% Working Capital Assumptions: Minimum Cash Balance as % of Sales Days Sales Outstanding Inventory Turnover (prod. cost/ending inv.) Days Payable Outstanding (based on tot. op. exp.) 59.2x 59.2x 59.2x 59.2x 59.2x 59.2x 59.2x 59.2x 59.2x 12.2x 12.3x 12.6x 12.7x 12.7x 12.7x 12.7x 12.7x 12.7x 33.7x 33.8x 33.9x 33.9x 33.9x 33.9x 33.9x 33.9x 33.9x Capital Expenditures 4,610 0 310 310 2,192 826 875 928 983 1,043 1,105
Step by Step Solution
There are 3 Steps involved in it

Get step-by-step solutions from verified subject matter experts