

Question: Consider the competitive market for steel. Assume that, regardless of how many firms are in the industry, every firm in the industry is identical and
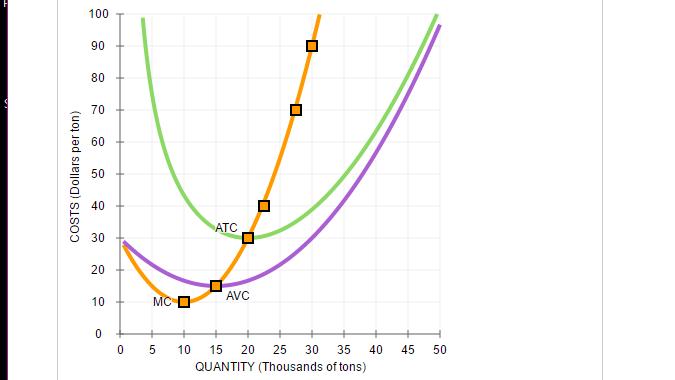
Consider the competitive market for steel. Assume that, regardless of how many firms are in the industry, every firm in the industry is identical and faces the marginal cost (MC), average total cost (ATC), and average variable cost (AVC) curves shown on the following graph.
The following diagram shows the market demand for steel.
Use the orange points (square symbol) to plot the initial short-run industry supply curve when there are 20 firms in the market. (Hint: You can disregard the portion of the supply curve that corresponds to prices where there is no output since this is the industry supply curve.) Next, use the purple points (diamond symbol) to plot the short-run industry supply curve when there are 30 firms. Finally, use the green points (triangle symbol) to plot the short-run industry supply curve when there are 40 firms.
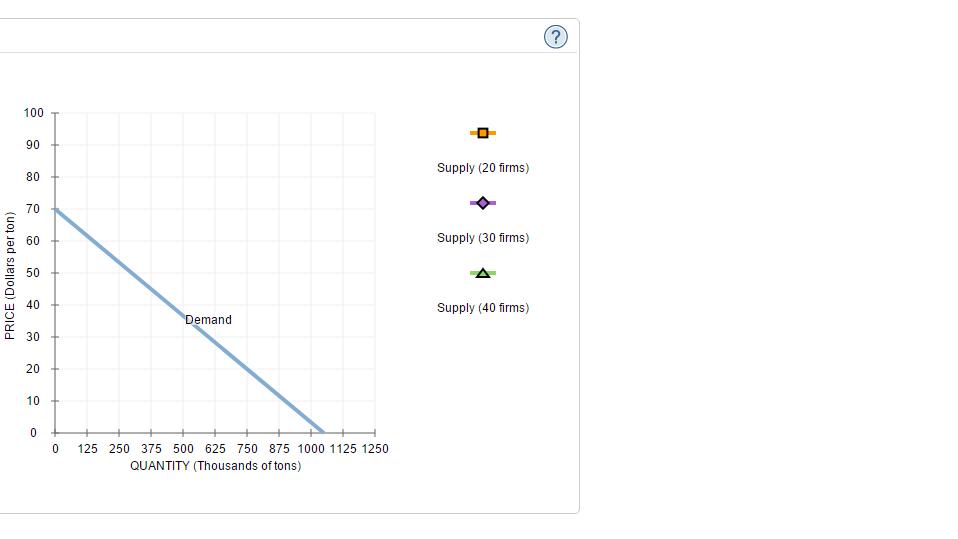
If there were 20 firms in this market, the short-run equilibrium price of steel would be $_________per ton. At that price, firms in this industry would (SHUT DOWN, EARN ZERO PROFIT, OPERATE AT A LOSS, OR EARN POSITIVE PROFIT . Therefore, in the long run, firms would ( ENTER, EXIT, OR NEITHER ) the steel market.
Because you know that competitive firms earn ( ZERO, NEGATIVE OR POSITIVE ) economic profit in the long run, you know the long-run equilibrium price must be &__________per ton. From the graph, you can see that this means there will be ( 20,30,or 40 ) firms operating in the steel industry in long-run equilibrium.
True or False: Assuming implicit costs are positive, each of the firms operating in this industry in the long run earns positive accounting profit.
True
False
100 90 80 70 60 50 40 ATC 30 20 AVC 10 MC O 10 15 20 25 30 35 40 45 50 QUANTITY (Thousands of tons) COSTS (Dollars per ton)
Step by Step Solution
3.26 Rating (144 Votes )
There are 3 Steps involved in it
The supply curve is represented by the sloping region of the curve moving upwards above the minimu... View full answer

Get step-by-step solutions from verified subject matter experts