

Question: Use the outputs for cross-tabulation and chi-square. Make conclusions based on columns % difference, Chi-Square, Cramer's V. Reported health status * Region Crosstab Region Northeast
Use the outputs for cross-tabulation and chi-square. Make conclusions based on columns % difference, Chi-Square, Cramer's V.
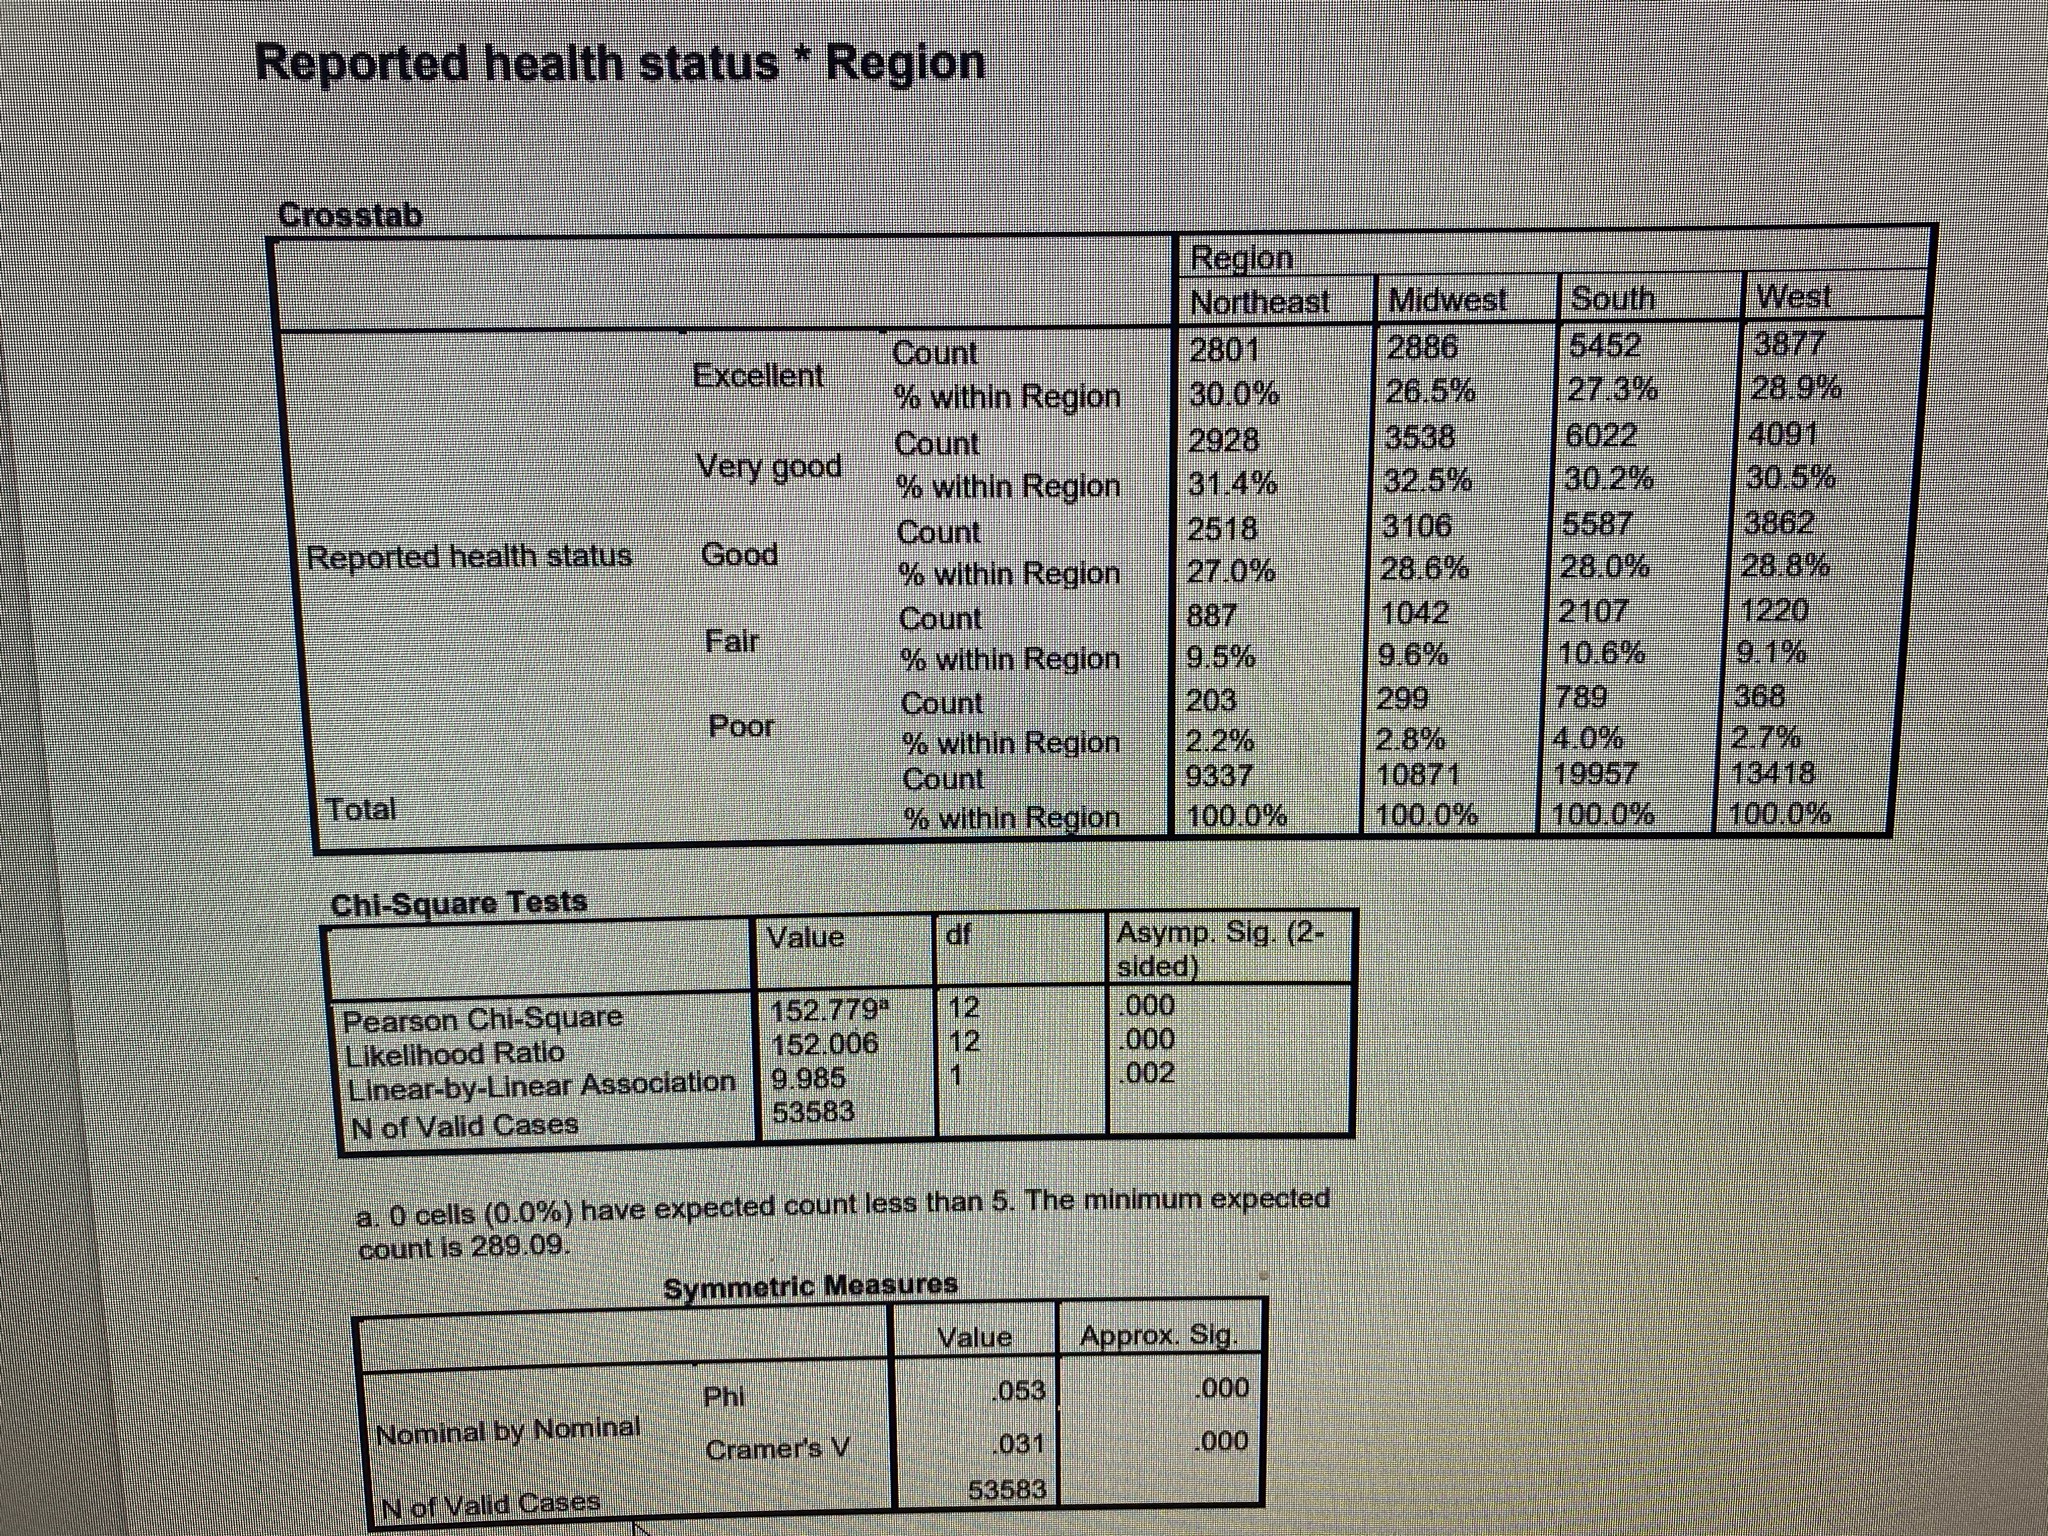
Reported health status * Region Crosstab Region Northeast Midwest South West Count 2801 2886 5452 3877 Excellent % within Region 30.0% 26.5% 27.3% 28.9% Very good Count 2928 3538 6022 4091 % within Region 31.4% 32.5% 30.2% 30.5% Reported health status Good Count 2518 3106 5587 3862 % within Region 27.0% 28.6% 28.0% 28.8% Count 887 1042 2107 1220 Fair % within Region 9.5% 9.6% 10.6% 9.1% Count 203 299 789 368 Poor within Region 2.2% 2.8% 4.0% 2.7% Count 9337 10871 19957 13418 Total % within Region 100.0% 100.0% 100.0% 100.0% Chi-Square Tests Value JP Asymp. Sig. (2- sided Pearson Chi-Square 152.779" 000 Likelihood Ratio 152.006 000 Linear-by-Linear Association 9.985 002 N of Valid Cases 53583 a. 0 cells (0.0%) have expected count less than 5. The minimum expected count is 289.09. Symmetric Measures Value Approx. Sig. Phi 053 000 Nominal by Nominal Cramer's V 03 000 IN of Valid Cases 53583
Step by Step Solution
There are 3 Steps involved in it

Get step-by-step solutions from verified subject matter experts