

Question: Use the Overhead Cost Activity Analysis in Exhibit 5 and other data on manufacturing costs to estimate product costs for valves, pumps, and flow controllers.
-
Use the Overhead Cost Activity Analysis in Exhibit 5 and other data on manufacturing costs to estimate product costs for valves, pumps, and flow controllers.
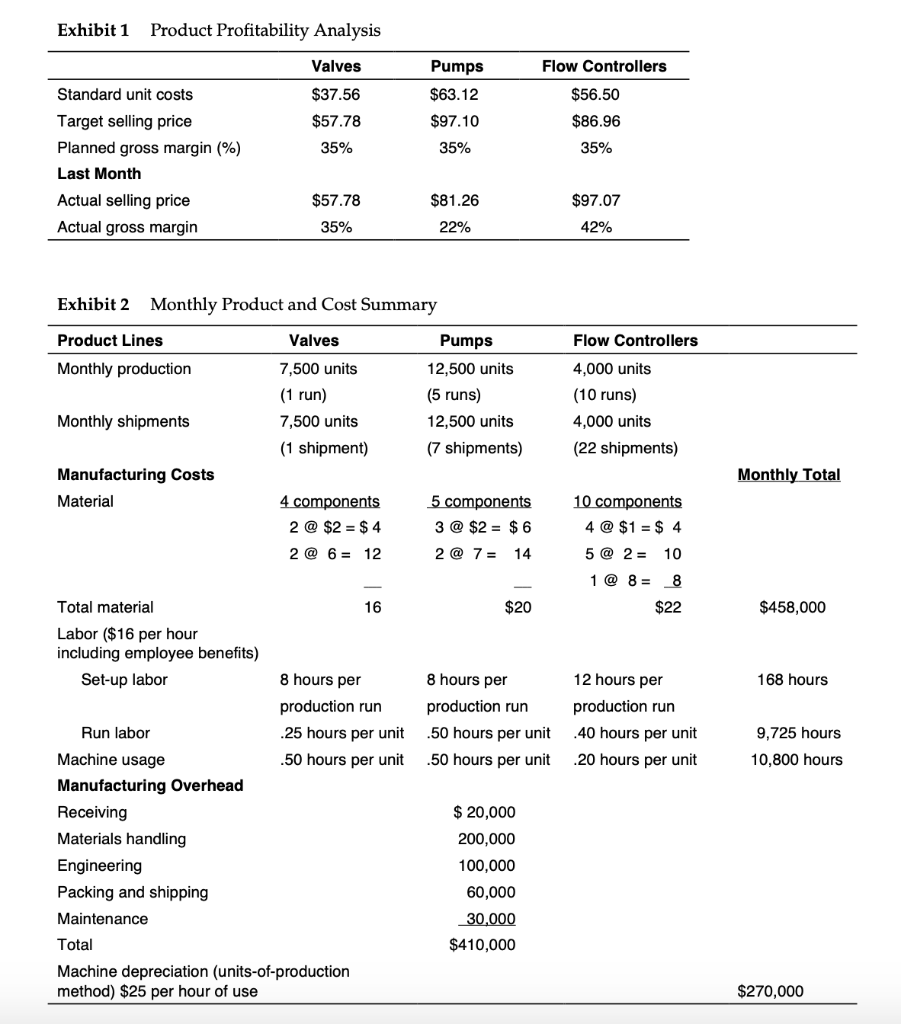
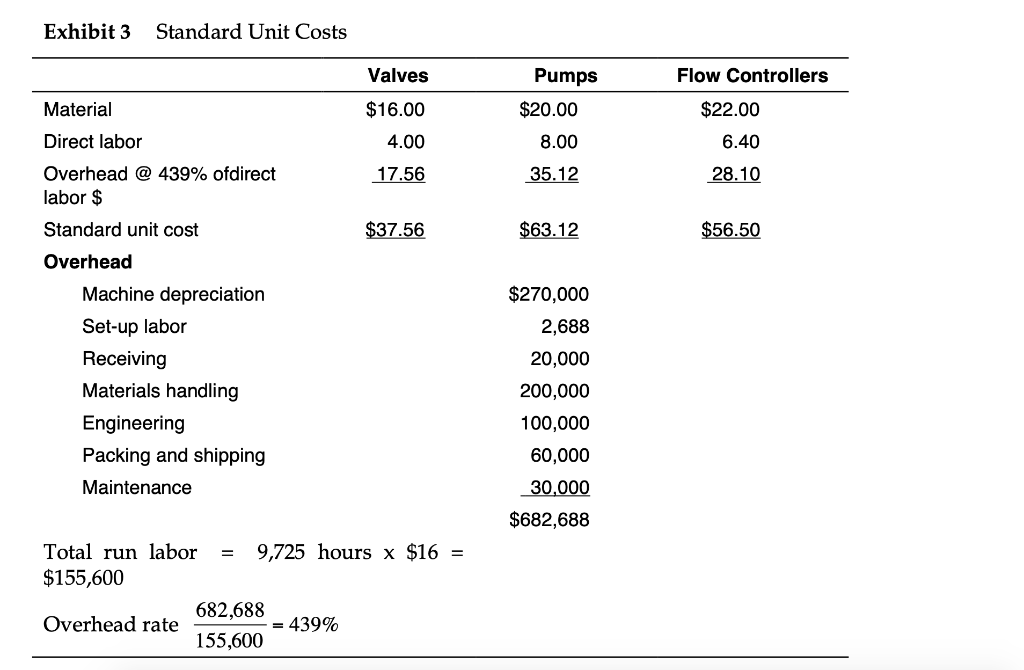
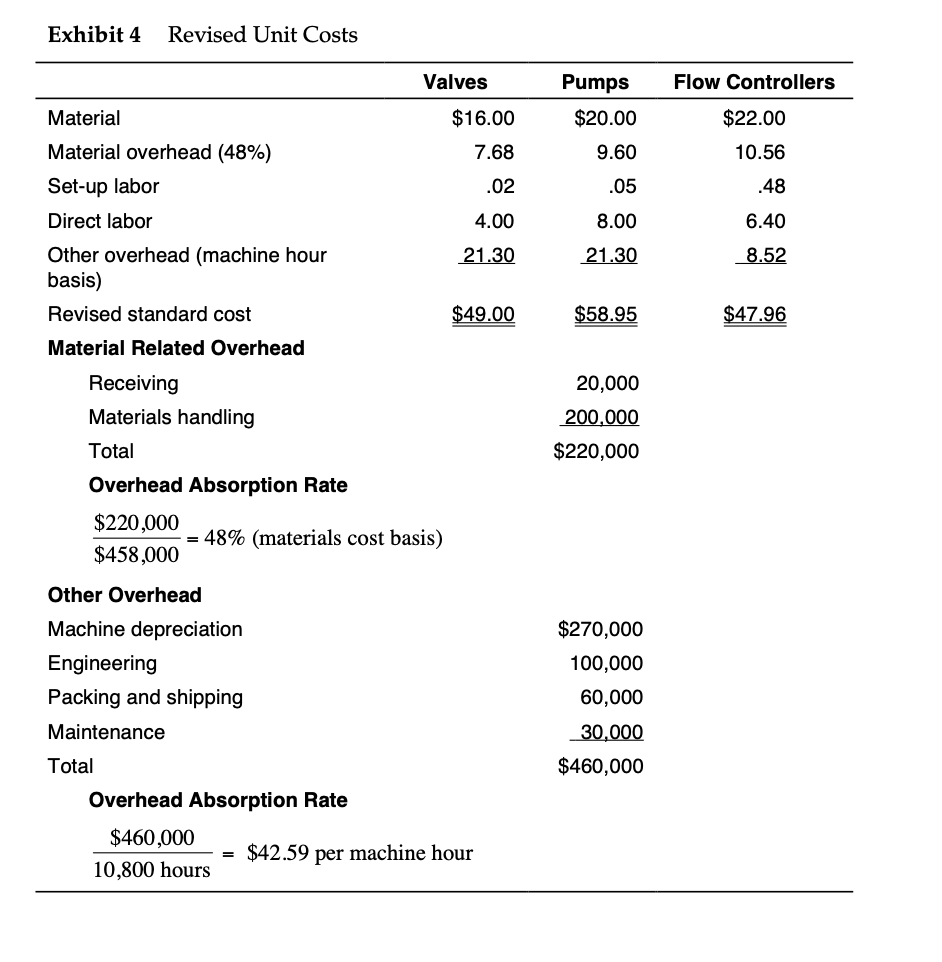
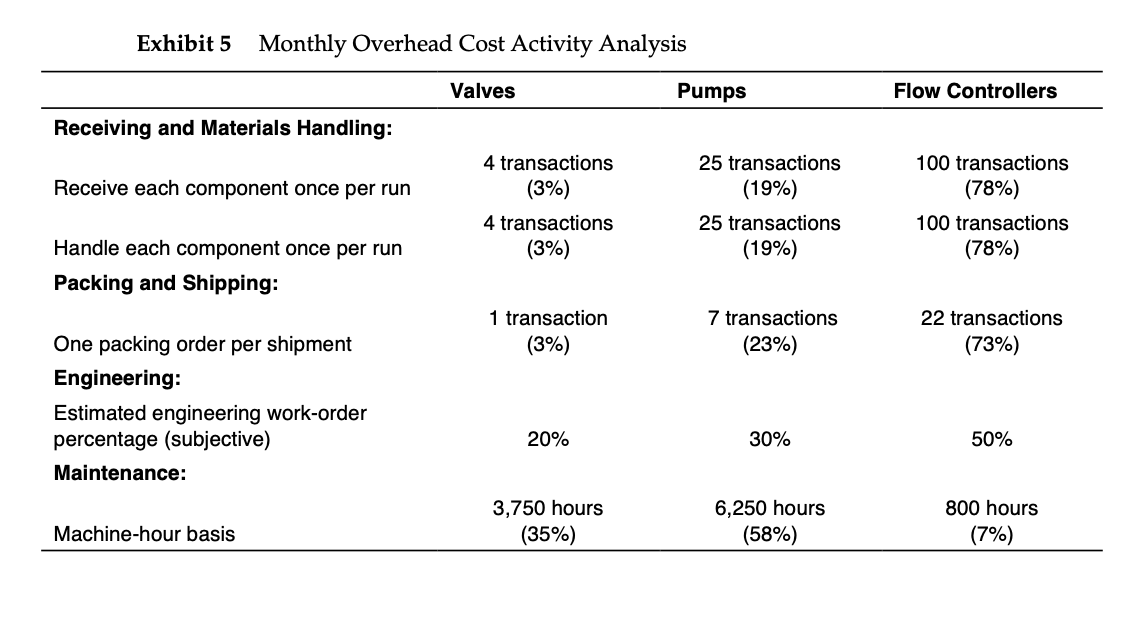
Exhibit 1 Product Profitability Analysis Valves Pumps Flow Controllers $63.12 $56.50 $37.56 $57.78 35% $86.96 $97.10 35% 35% Standard unit costs Target selling price Planned gross margin (%) Last Month Actual selling price Actual gross margin $57.78 $81.26 22% $97.07 42% 35% Exhibit 2 Monthly Product and Cost Summary Product Lines Valves Monthly production 7,500 units (1 run) 7,500 units (1 shipment) Pumps 12,500 units (5 runs) 12,500 units (7 shipments) Flow Controllers 4,000 units (10 runs) 4,000 units (22 shipments) Monthly shipments Monthly Total Manufacturing Costs Material 4 components 2 @ $2 = $ 4 5 components 3 @ $2 = $6 2 @ 7= 14 10 components 4 @ $1 = $ 4 5 @ 2 = 10 1 @ 8 = 8 2 @ 6 = 12 $20 $22 $458,000 8 hours per 168 hours production run .50 hours per unit .50 hours per unit 12 hours per production run 40 hours per unit .20 hours per unit 9,725 hours 10,800 hours Total material 16 Labor ($16 per hour including employee benefits) Set-up labor 8 hours per production run Run labor .25 hours per unit Machine usage .50 hours per unit Manufacturing Overhead Receiving Materials handling Engineering Packing and shipping Maintenance Total Machine depreciation (units-of-production method) $25 per hour of use $ 20,000 200,000 100,000 60,000 30,000 $410,000 $270,000 Exhibit 3 Standard Unit Costs Valves Pumps Flow Controllers Material $16.00 $20.00 $22.00 Direct labor 4.00 8.00 6.40 17.56 35.12 28.10 Overhead @ 439% ofdirect labor $ Standard unit cost $37.56 $63.12 $56.50 Overhead Machine depreciation Set-up labor Receiving Materials handling Engineering Packing and shipping Maintenance $270,000 2,688 20,000 200,000 100,000 60,000 30,000 $682,688 = Total run labor 9,725 hours x $16 = $155,600 682,688 Overhead rate 439% 155,600 Exhibit 4 Revised Unit Costs Valves Pumps Flow Controllers Material $20.00 $16.00 7.68 $22.00 10.56 9.60 Material overhead (48%) Set-up labor Direct labor .02 .05 48 4.00 8.00 6.40 21.30 21.30 8.52 Other overhead (machine hour basis) Revised Standard cost $49.00 $58.95 $47.96 Material Related Overhead 20,000 200,000 $220,000 Receiving Materials handling Total Overhead Absorption Rate $220,000 = 48% (materials cost basis) $458,000 Other Overhead Machine depreciation Engineering Packing and shipping Maintenance Total Overhead Absorption Rate $460,000 $42.59 per machine hour 10,800 hours $270,000 100,000 60,000 30,000 $460,000 Exhibit 5 Monthly Overhead Cost Activity Analysis Valves Pumps Flow Controllers Receiving and Materials Handling: Receive each component once per run 4 transactions (3%) 25 transactions (19%) 25 transactions (19%) 100 transactions (78%) 100 transactions (78%) 4 transactions (3%) Handle each component once per run Packing and Shipping: 1 transaction (3%) 7 transactions (23%) 22 transactions (73%) One packing order per shipment Engineering: Estimated engineering work-order percentage (subjective) Maintenance: 20% 30% 50% 3,750 hours (35%) 6,250 hours (58%) 800 hours (7%) Machine-hour basis Exhibit 1 Product Profitability Analysis Valves Pumps Flow Controllers $63.12 $56.50 $37.56 $57.78 35% $86.96 $97.10 35% 35% Standard unit costs Target selling price Planned gross margin (%) Last Month Actual selling price Actual gross margin $57.78 $81.26 22% $97.07 42% 35% Exhibit 2 Monthly Product and Cost Summary Product Lines Valves Monthly production 7,500 units (1 run) 7,500 units (1 shipment) Pumps 12,500 units (5 runs) 12,500 units (7 shipments) Flow Controllers 4,000 units (10 runs) 4,000 units (22 shipments) Monthly shipments Monthly Total Manufacturing Costs Material 4 components 2 @ $2 = $ 4 5 components 3 @ $2 = $6 2 @ 7= 14 10 components 4 @ $1 = $ 4 5 @ 2 = 10 1 @ 8 = 8 2 @ 6 = 12 $20 $22 $458,000 8 hours per 168 hours production run .50 hours per unit .50 hours per unit 12 hours per production run 40 hours per unit .20 hours per unit 9,725 hours 10,800 hours Total material 16 Labor ($16 per hour including employee benefits) Set-up labor 8 hours per production run Run labor .25 hours per unit Machine usage .50 hours per unit Manufacturing Overhead Receiving Materials handling Engineering Packing and shipping Maintenance Total Machine depreciation (units-of-production method) $25 per hour of use $ 20,000 200,000 100,000 60,000 30,000 $410,000 $270,000 Exhibit 3 Standard Unit Costs Valves Pumps Flow Controllers Material $16.00 $20.00 $22.00 Direct labor 4.00 8.00 6.40 17.56 35.12 28.10 Overhead @ 439% ofdirect labor $ Standard unit cost $37.56 $63.12 $56.50 Overhead Machine depreciation Set-up labor Receiving Materials handling Engineering Packing and shipping Maintenance $270,000 2,688 20,000 200,000 100,000 60,000 30,000 $682,688 = Total run labor 9,725 hours x $16 = $155,600 682,688 Overhead rate 439% 155,600 Exhibit 4 Revised Unit Costs Valves Pumps Flow Controllers Material $20.00 $16.00 7.68 $22.00 10.56 9.60 Material overhead (48%) Set-up labor Direct labor .02 .05 48 4.00 8.00 6.40 21.30 21.30 8.52 Other overhead (machine hour basis) Revised Standard cost $49.00 $58.95 $47.96 Material Related Overhead 20,000 200,000 $220,000 Receiving Materials handling Total Overhead Absorption Rate $220,000 = 48% (materials cost basis) $458,000 Other Overhead Machine depreciation Engineering Packing and shipping Maintenance Total Overhead Absorption Rate $460,000 $42.59 per machine hour 10,800 hours $270,000 100,000 60,000 30,000 $460,000 Exhibit 5 Monthly Overhead Cost Activity Analysis Valves Pumps Flow Controllers Receiving and Materials Handling: Receive each component once per run 4 transactions (3%) 25 transactions (19%) 25 transactions (19%) 100 transactions (78%) 100 transactions (78%) 4 transactions (3%) Handle each component once per run Packing and Shipping: 1 transaction (3%) 7 transactions (23%) 22 transactions (73%) One packing order per shipment Engineering: Estimated engineering work-order percentage (subjective) Maintenance: 20% 30% 50% 3,750 hours (35%) 6,250 hours (58%) 800 hours (7%) Machine-hour basis
Step by Step Solution
There are 3 Steps involved in it

Get step-by-step solutions from verified subject matter experts