

Question: Use the past demand data to develop the forecast for 2024 and 2025 (Naive method, moving average, weighted moving average, exponential smoothing). Provide a brief
Use the past demand data to develop the forecast for 2024 and 2025 (Naive method, moving average, weighted moving average, exponential smoothing). Provide a brief justification for a chosen approach.
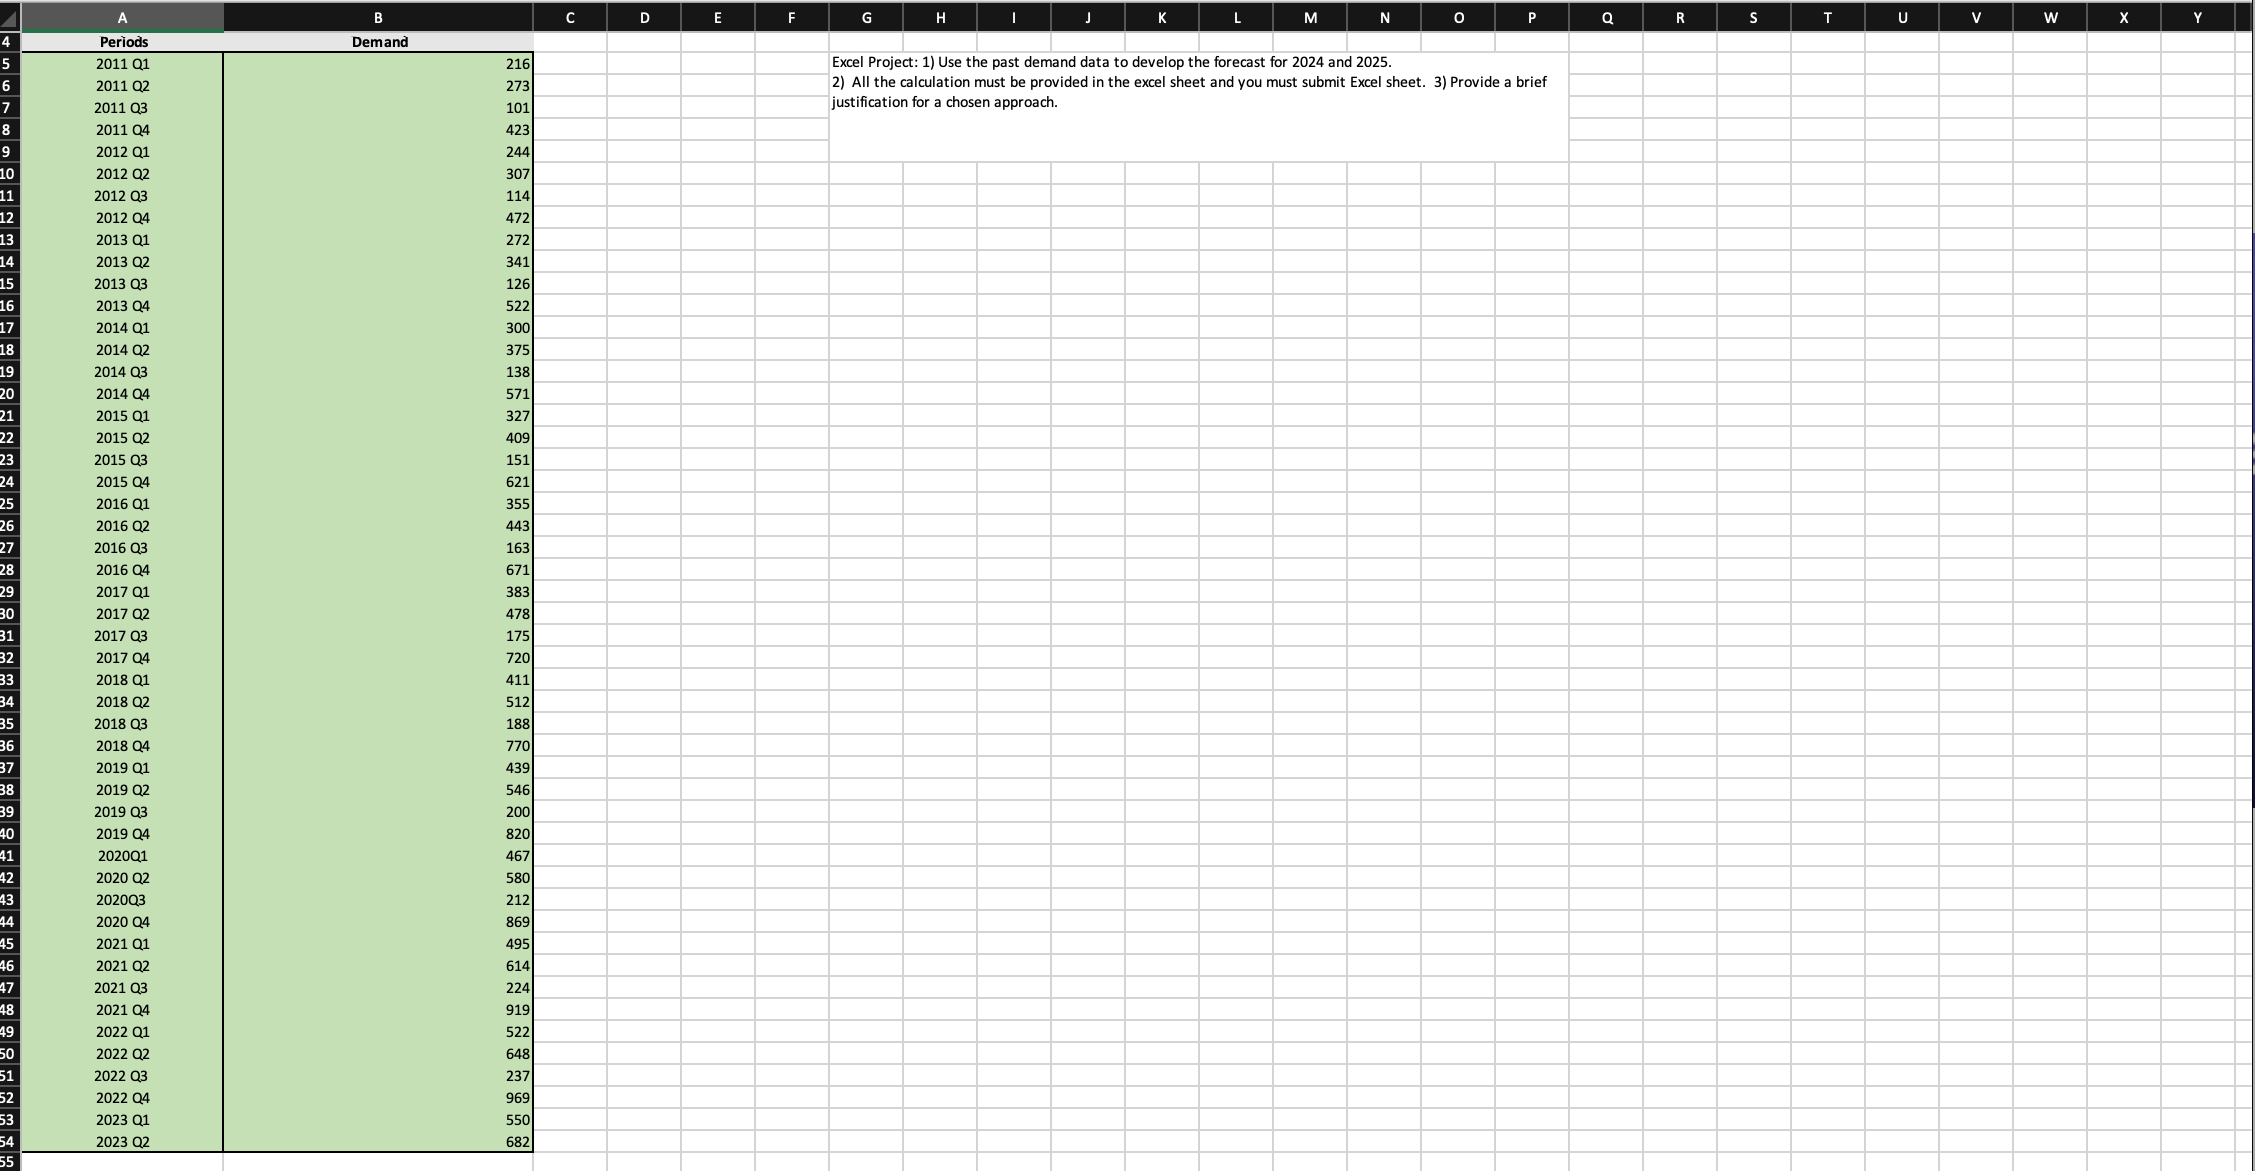
\begin{tabular}{|c|c|c|c|c|c|c|c|c|c|c|c|c|c|c|c|c|c|c|c|c|c|c|} \hline A & B & & c & D & E & F & G & \begin{tabular}{l|l|} H & I \\ \end{tabular} & J & \begin{tabular}{l|l|} \end{tabular} & M & 0 & p & & \begin{tabular}{ll} & R \\ \end{tabular} & s & T & u & v & w & x & Y \\ \hline Periods & Demar & & & & & & \multirow{3}{*}{\multicolumn{5}{|c|}{\begin{tabular}{l} Excel Project: 1) Use the past demand data to develop the forecast for 2024 and 2025 . \\ 2) Al the calculation must be provided in the excel sheet and you must submit Exeel sheet. \end{tabular}}} & & & & & & & & & & & \\ \hline 2011 Q1 & & 216 & & & & & & & & & & & & & & & & & & & & \\ \hline 2011Q2 & & 273 & & & & & \multirow{2}{*}{\multicolumn{7}{|c|}{\begin{tabular}{l} 2) All the calculation must be provided in the excel sheet and you must submit Excel sheet. 3) Provide a brief \\ justification for a chosen approach. \end{tabular}}} & & & & & & & & & \\ \hline 2011 Q3 & & 101 & & & & & & & & & & & & & & & & & & & & \\ \hline \begin{tabular}{ll} 201104 \\ 201201 \end{tabular} & & \begin{tabular}{l} 423 \\ 244 \end{tabular} & & & & & & & & & & & & & & & & & & & & \\ \hline \begin{tabular}{l} 2012 Q1 \\ 2012 Q2 \end{tabular} & & \begin{tabular}{l} 244 \\ 307 \end{tabular} & & & & & & & & & & & & & & & & & & & & \\ \hline 2012 Q3 & & 114 & & & & & & & & & & & & & & & & & & & & \\ \hline 2012 Q4 & & 472 & & & & & & & & & & & & & & & & & & & & \\ \hline 2013 Q1 & & 272 & & & & & & & & & & & & & & & & & & & & \\ \hline 2013 Q2 & & 341 & & & & & & & & & & & & & & & & & & & & \\ \hline 2013 Q3 & & 126 & & & & & & & & & & & & & & & & & & & & \\ \hline 2013 Q4 & & 522 & & & & & & & & & & & & & & & & & & & & \\ \hline 2014 Q.1 & & 300 & & & & & & & & & & & & & & & & & & & & \\ \hline 2014 Q2 & & 375 & & & & & & & & & & & & & & & & & & & & \\ \hline 2014 Q3 & & \begin{tabular}{l} 138 \\ 571 \end{tabular} & & & & & & & & & & & & & & & & & & & & \\ \hline 2014 Q4 & & \begin{tabular}{l} 5/1 \\ 327 \end{tabular} & & & & & & & & & & & & & & & & & & & & \\ \hline \begin{tabular}{l} 2015Q1 \\ 2015Q2 \end{tabular} & & 409 & & & & & & & & & & & & & & & & & & & & \\ \hline 2015Q,3 & & 151 & & & & & & & & & & & & & & & & & & & & \\ \hline 2015 Q4 & & 621 & & & & & & & & & & & & & & & & & & & & \\ \hline 2016 Q1 & & 355 & & & & & & & & & & & & & & & & & & & & \\ \hline 2016 Q2 & & 443 & & & & & & & & & & & & & & & & & & & & \\ \hline 2016 Q3 & & 163 & & & & & & & & & & & & & & & & & & & & \\ \hline 2016 Q4 & & 671 & & & & & & & & & & & & & & & & & & & & \\ \hline 2017 Q. & & 383 & & & & & & & & & & & & & & & & & & & & \\ \hline 2017 Q2 & & \begin{tabular}{lll} 478 \\ \end{tabular} & & & & & & & & & & & & & & & & & & & & \\ \hline 2017 Q3 & & 175 & & & & & & & & & & & & & & & & & & & & \\ \hline \begin{tabular}{l} 2017 Q4 \\ 2018 Q1 \end{tabular} & & \begin{tabular}{l} 720 \\ 411 \end{tabular} & & & & & & & & & & & & & & & & & & & & \\ \hline 2018 Q1 & & \begin{tabular}{r} 411 \\ 151 \end{tabular} & & & & & & & & & & & & & & & & & & & & \\ \hline \begin{tabular}{l} 2018 Q2 \\ 2018 Q3 \end{tabular} & & 188 & & & & & & & & & & & & & & & & & & & & \\ \hline \begin{tabular}{l} 2018 Q3 \\ 2018 Q4 \end{tabular} & & 770 & & & & & & & & & & & & & & & & & & & & \\ \hline \begin{tabular}{l} 2018,1 \\ 2019 Q. \end{tabular} & & 439 & & & & & & & & & & & & & & & & & & & & \\ \hline 2019 Q2 & & 546 & & & & & & & & & & & & & & & & & & & & \\ \hline 2019 Q, 3 & & 200 & & & & & & & & & & & & & & & & & & & & \\ \hline 2019 Q4 & & 820 & & & & & & & & & & & & & & & & & & & & \\ \hline 202001 & & 467 & & & & & & & & & & & & & & & & & & & & \\ \hline 2020 Q2 & & 580 & & & & & & & & & & & & & & & & & & & & \\ \hline 202003 & & 212 & & & & & & & & & & & & & & & & & & & & \\ \hline 2020 Q4 & & 869 & & & & & & & & & & & & & & & & & & & & \\ \hline 2021 Q1 & & 495 & & & & & & & & & & & & & & & & & & & & \\ \hline 2021 Q2 & & \begin{tabular}{l} 614 \\ 224 \end{tabular} & & & & & & & & & & & & & & & & & & & & \\ \hline 2021 Q4 & & \begin{tabular}{l} 224 \\ 919 \end{tabular} & & & & & & & & & & & & & & & & & & & & \\ \hline 2022 Q.1 & & 522 & & & & & & & & & & & & & & & & & & & & \\ \hline 202202 & & 648 & & & & & & & & & & & & & & & & & & & & \\ \hline 2022 Q3 & & 237 & & & & & & & & & & & & & & & & & & & & \\ \hline 2022 Q4 & & 969 & & & & & & & & & & & & & & & & & & & & \\ \hline 2023 & & 550 & & & & & & & & & & & & & & & & & & & & \\ \hline 2023 Q2.2 & & 682 & & & & & & & & & & & & & & & & & & & & \\ \hline \end{tabular}
Step by Step Solution
There are 3 Steps involved in it

Get step-by-step solutions from verified subject matter experts