

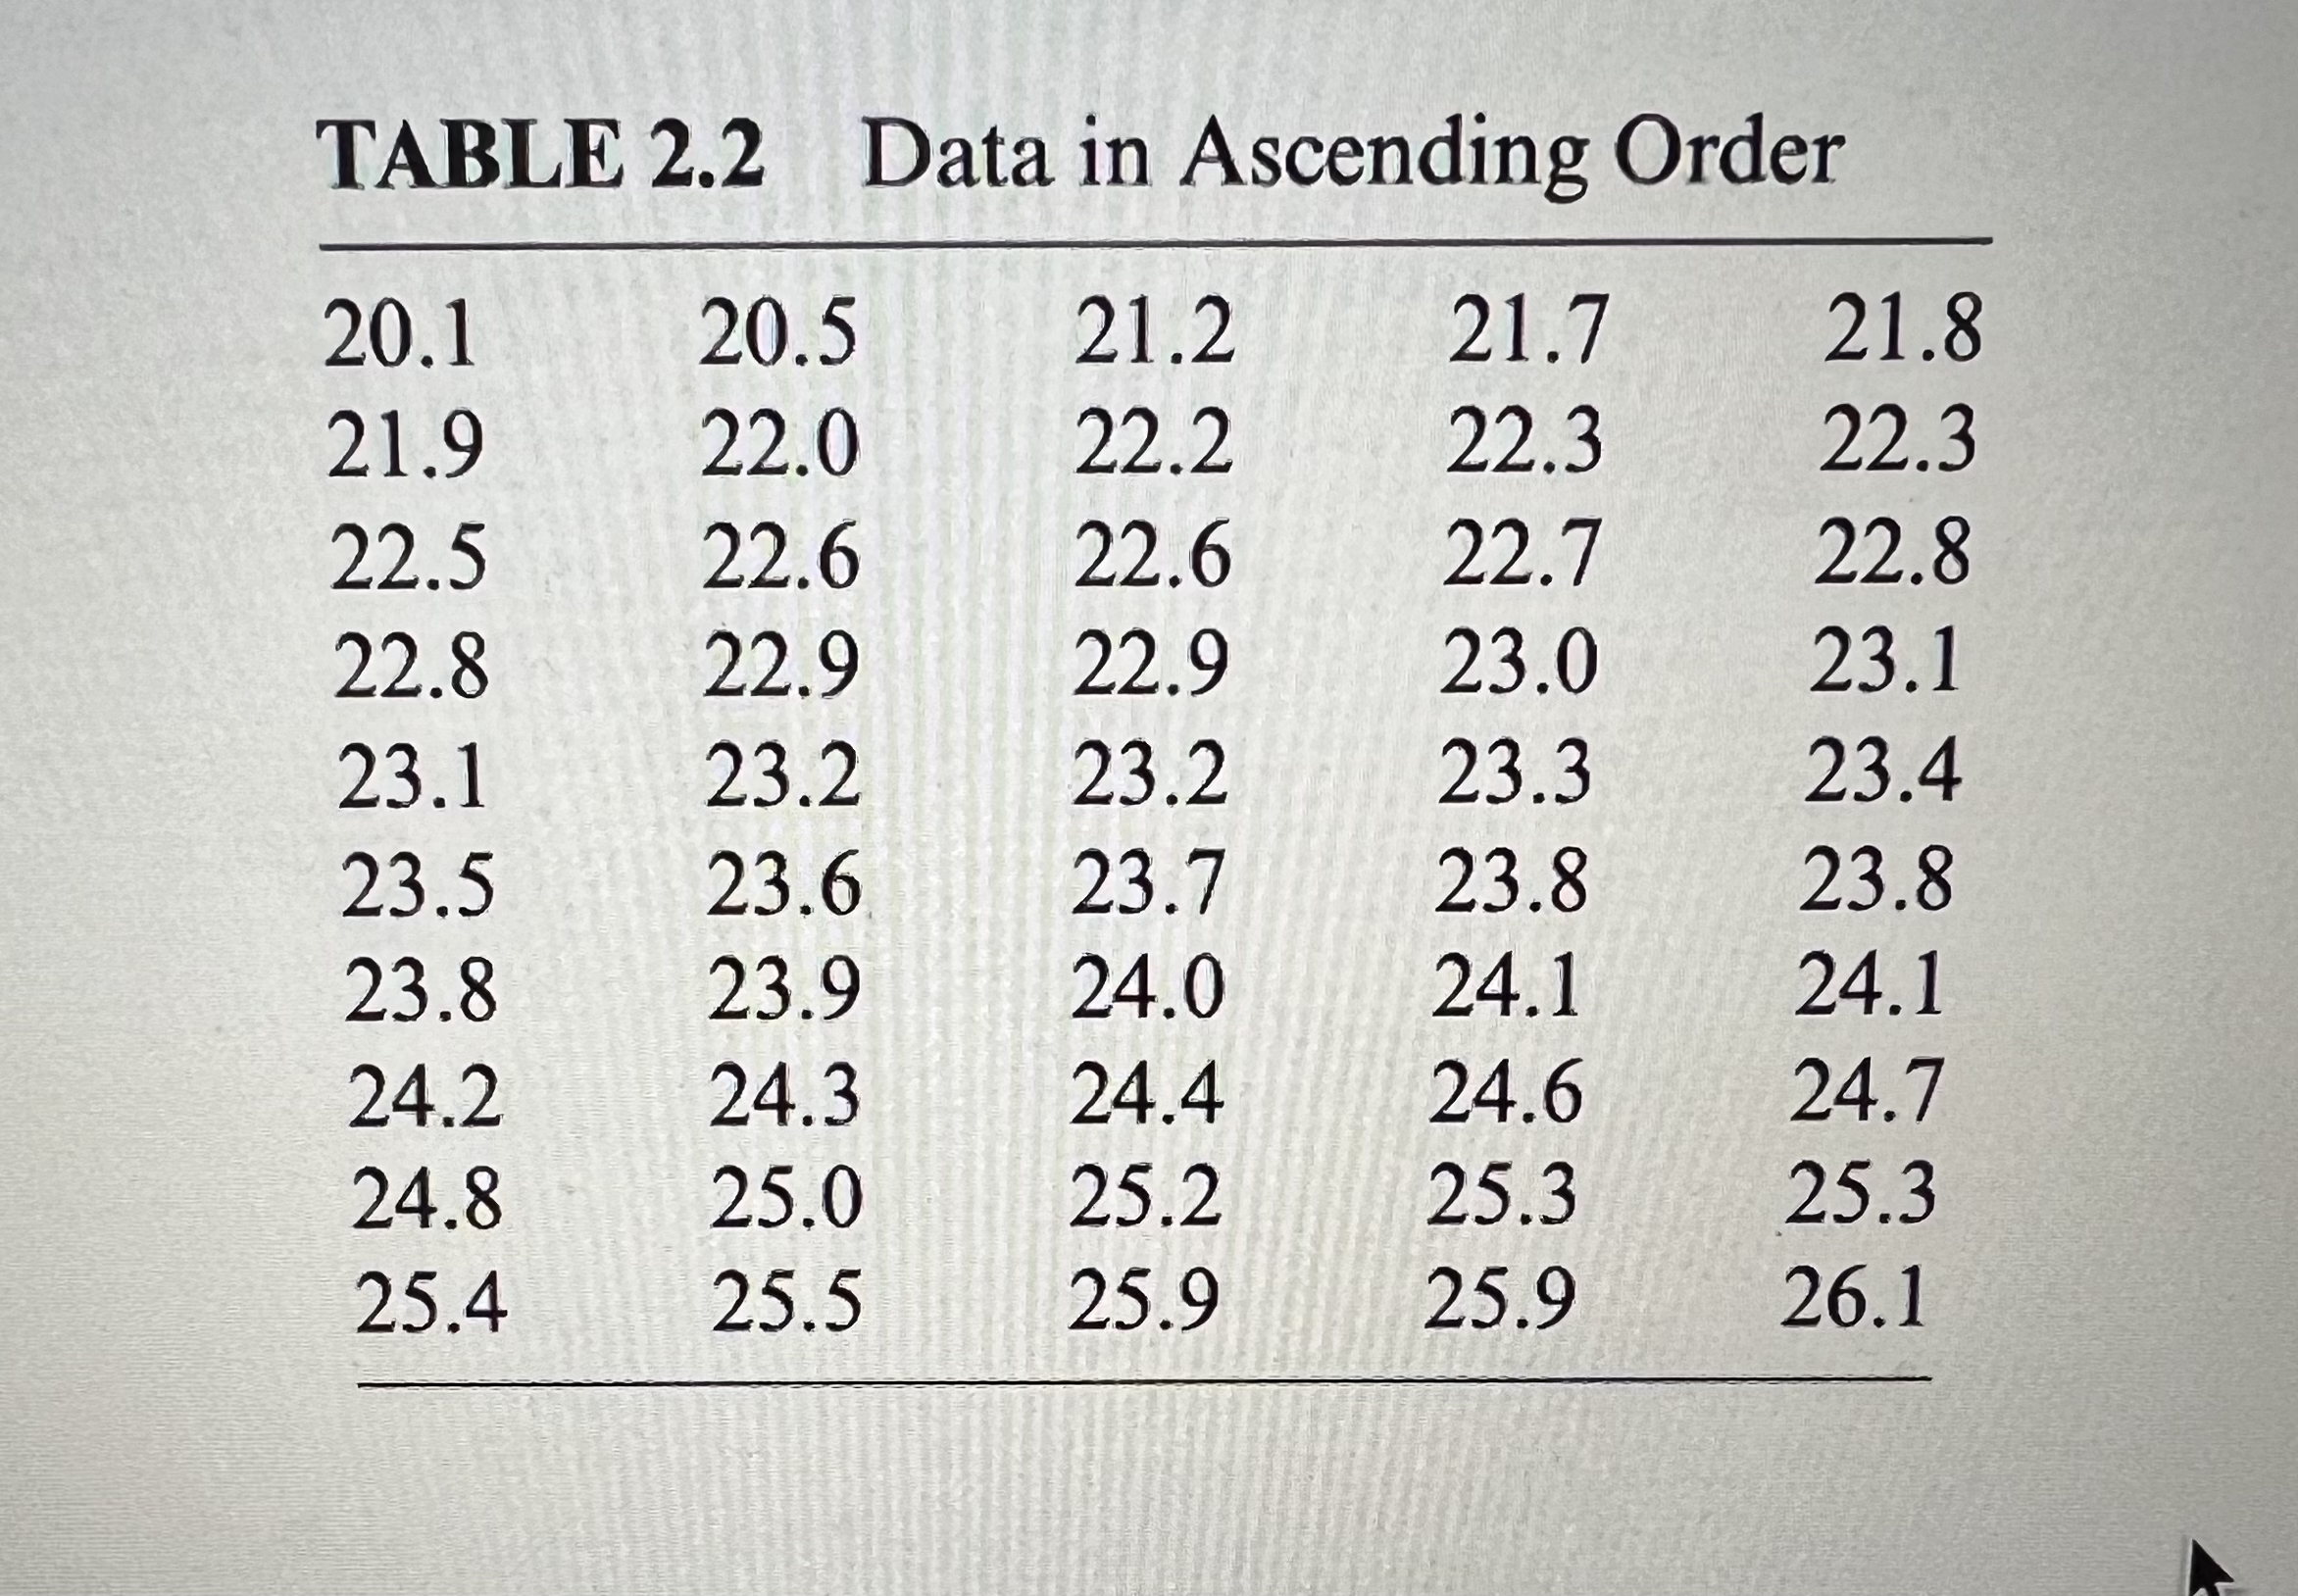
Question: Use the program STATS to compute the mean, median, mode, and standard deviation of the data in table 2 . 2 and plot a centered
Use the program STATS to compute the mean, median, mode, and standard deviation of the data in table and plot a centered histogram of the data using nine intervals.
Step by Step Solution
There are 3 Steps involved in it
1 Expert Approved Answer
Step: 1 Unlock

Question Has Been Solved by an Expert!
Get step-by-step solutions from verified subject matter experts
Step: 2 Unlock
Step: 3 Unlock