

Question: Use the provided regression analysis to construct a 95% interval for the mean value of y given x = 60. is the answer: [621.054, 633.472]
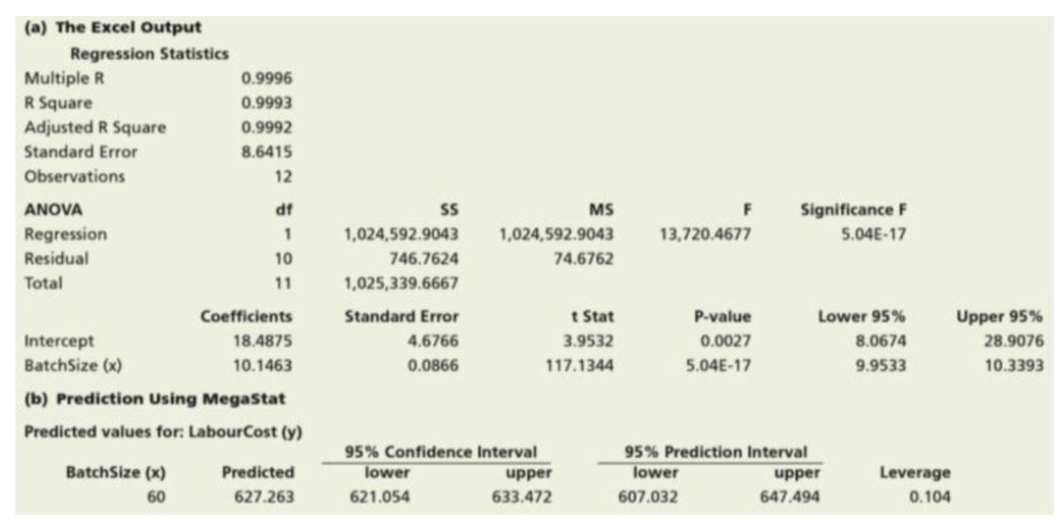
Use the provided regression analysis to construct a 95% interval for the mean value of y given x = 60.
is the answer: [621.054, 633.472]
\begin{tabular}{|c|c|c|c|c|c|c|} \hline \multicolumn{7}{|c|}{ (a) The Excel Output } \\ \hline \multicolumn{7}{|c|}{ Regression Statistics } \\ \hline Multiple R & 0.9996 & & & & & \\ \hline R Square & 0.9993 & & & & & \\ \hline Adjusted R Square & 0.9992 & & & & & \\ \hline Standard Error & 8.6415 & & & & & \\ \hline Observations & 12 & & & & & \\ \hline ANOVA & df & ss & MS & & Significance F & \\ \hline Regression & 1 & 1,024,592.9043 & 1,024,592.9043 & 13, & 5.04E17 & \\ \hline Residual & 10 & 746.7624 & 74.6762 & & & \\ \hline \multirow[t]{2}{*}{ Total } & 11 & 1,025,339.6667 & & & & \\ \hline & Coefficients & Standard Error & t Stat & & Lower 95% & Upper 95% \\ \hline Intercept & 18.4875 & 4.6766 & 3.9532 & & 8.0674 & 28.9076 \\ \hline BatchSize (x) & 10.1463 & 0.0866 & 117.1344 & & 9.9533 & 10.3393 \\ \hline \multicolumn{7}{|c|}{ (b) Prediction Using Megastat } \\ \hline \multicolumn{7}{|c|}{ Predicted values for: LabourCost (y) } \\ \hline & & \multicolumn{2}{|c|}{95% Confidence Interval } & 95%Pr & \multirow{2}{*}{\multicolumn{2}{|c|}{ Leverage }} \\ \hline BatchSize (x) & Predicted & lower & upper & lower & & \\ \hline 60 & 627.263 & 621.054 & 633.472 & 607.032 & \multicolumn{2}{|c|}{0.104} \\ \hline \end{tabular}
Step by Step Solution
There are 3 Steps involved in it

Get step-by-step solutions from verified subject matter experts