

Question: Use the Recidivism.xls data, conduct a Chi-Square independence test (alpha= .05) in Excel to determine whether there is a significant relationship between RACE (1=Black, 2=White)
Use the Recidivism.xls data, conduct a Chi-Square independence test (alpha= .05) in Excel to determine whether there is a significant relationship between RACE (1=Black, 2=White) and RECIDIVSM (1=the ex-offender recidivated, 0=the ex-offender did not recidivate). Copy and paste the Excel output here. In your summary, please discuss the null hypothesis, alternative hypothesis, and the result of this hypothesis test, and interpret the result.
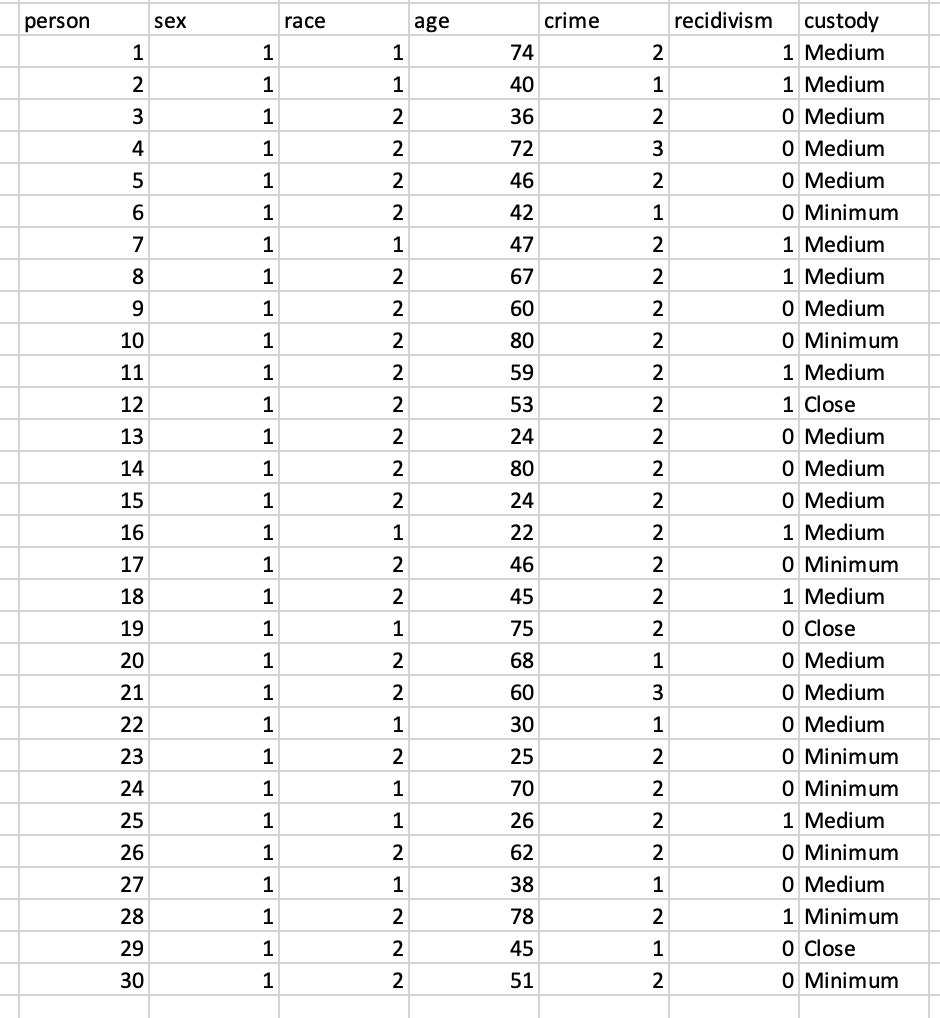
person sex race age crime recidivism 1 1 1 74 23456789012311672222232222223 1 1 40 1 2 1 2 72 1 2 1 2 1 1 47 1 2 67 1 2 60 1 2 1 2 59 1 2 1 2 1 2 1 2 1 1 1 2 1 2 1 1 1 2 1 2 1 1 1 2 1 1 1 1 1 2 1 1 2232422668 53222244786322263 2 custody 1 Medium 1 1 Medium 2 0 Medium 3 0 Medium 2 0 Medium 1 0 Minimum 2 1 Medium 2 1 Medium 2 0 Medium 80 2 0 Minimum 2 1 Medium 2 1 Close 2 0 Medium 80 2 0 Medium 2 0 Medium 2 1 Medium 2 0 Minimum 2 1 Medium 2 0 Close 1 0 Medium 60 3 0 Medium 30 1 0 Medium 2 0 Minimum 70 2 0 Minimum 2 1 Medium 2 0 Minimum 1 0 Medium 1 2 78 2 1 Minimum 1 2 45 1 0 Close 1 2 51 2 0 Minimum
Step by Step Solution
There are 3 Steps involved in it

Get step-by-step solutions from verified subject matter experts