

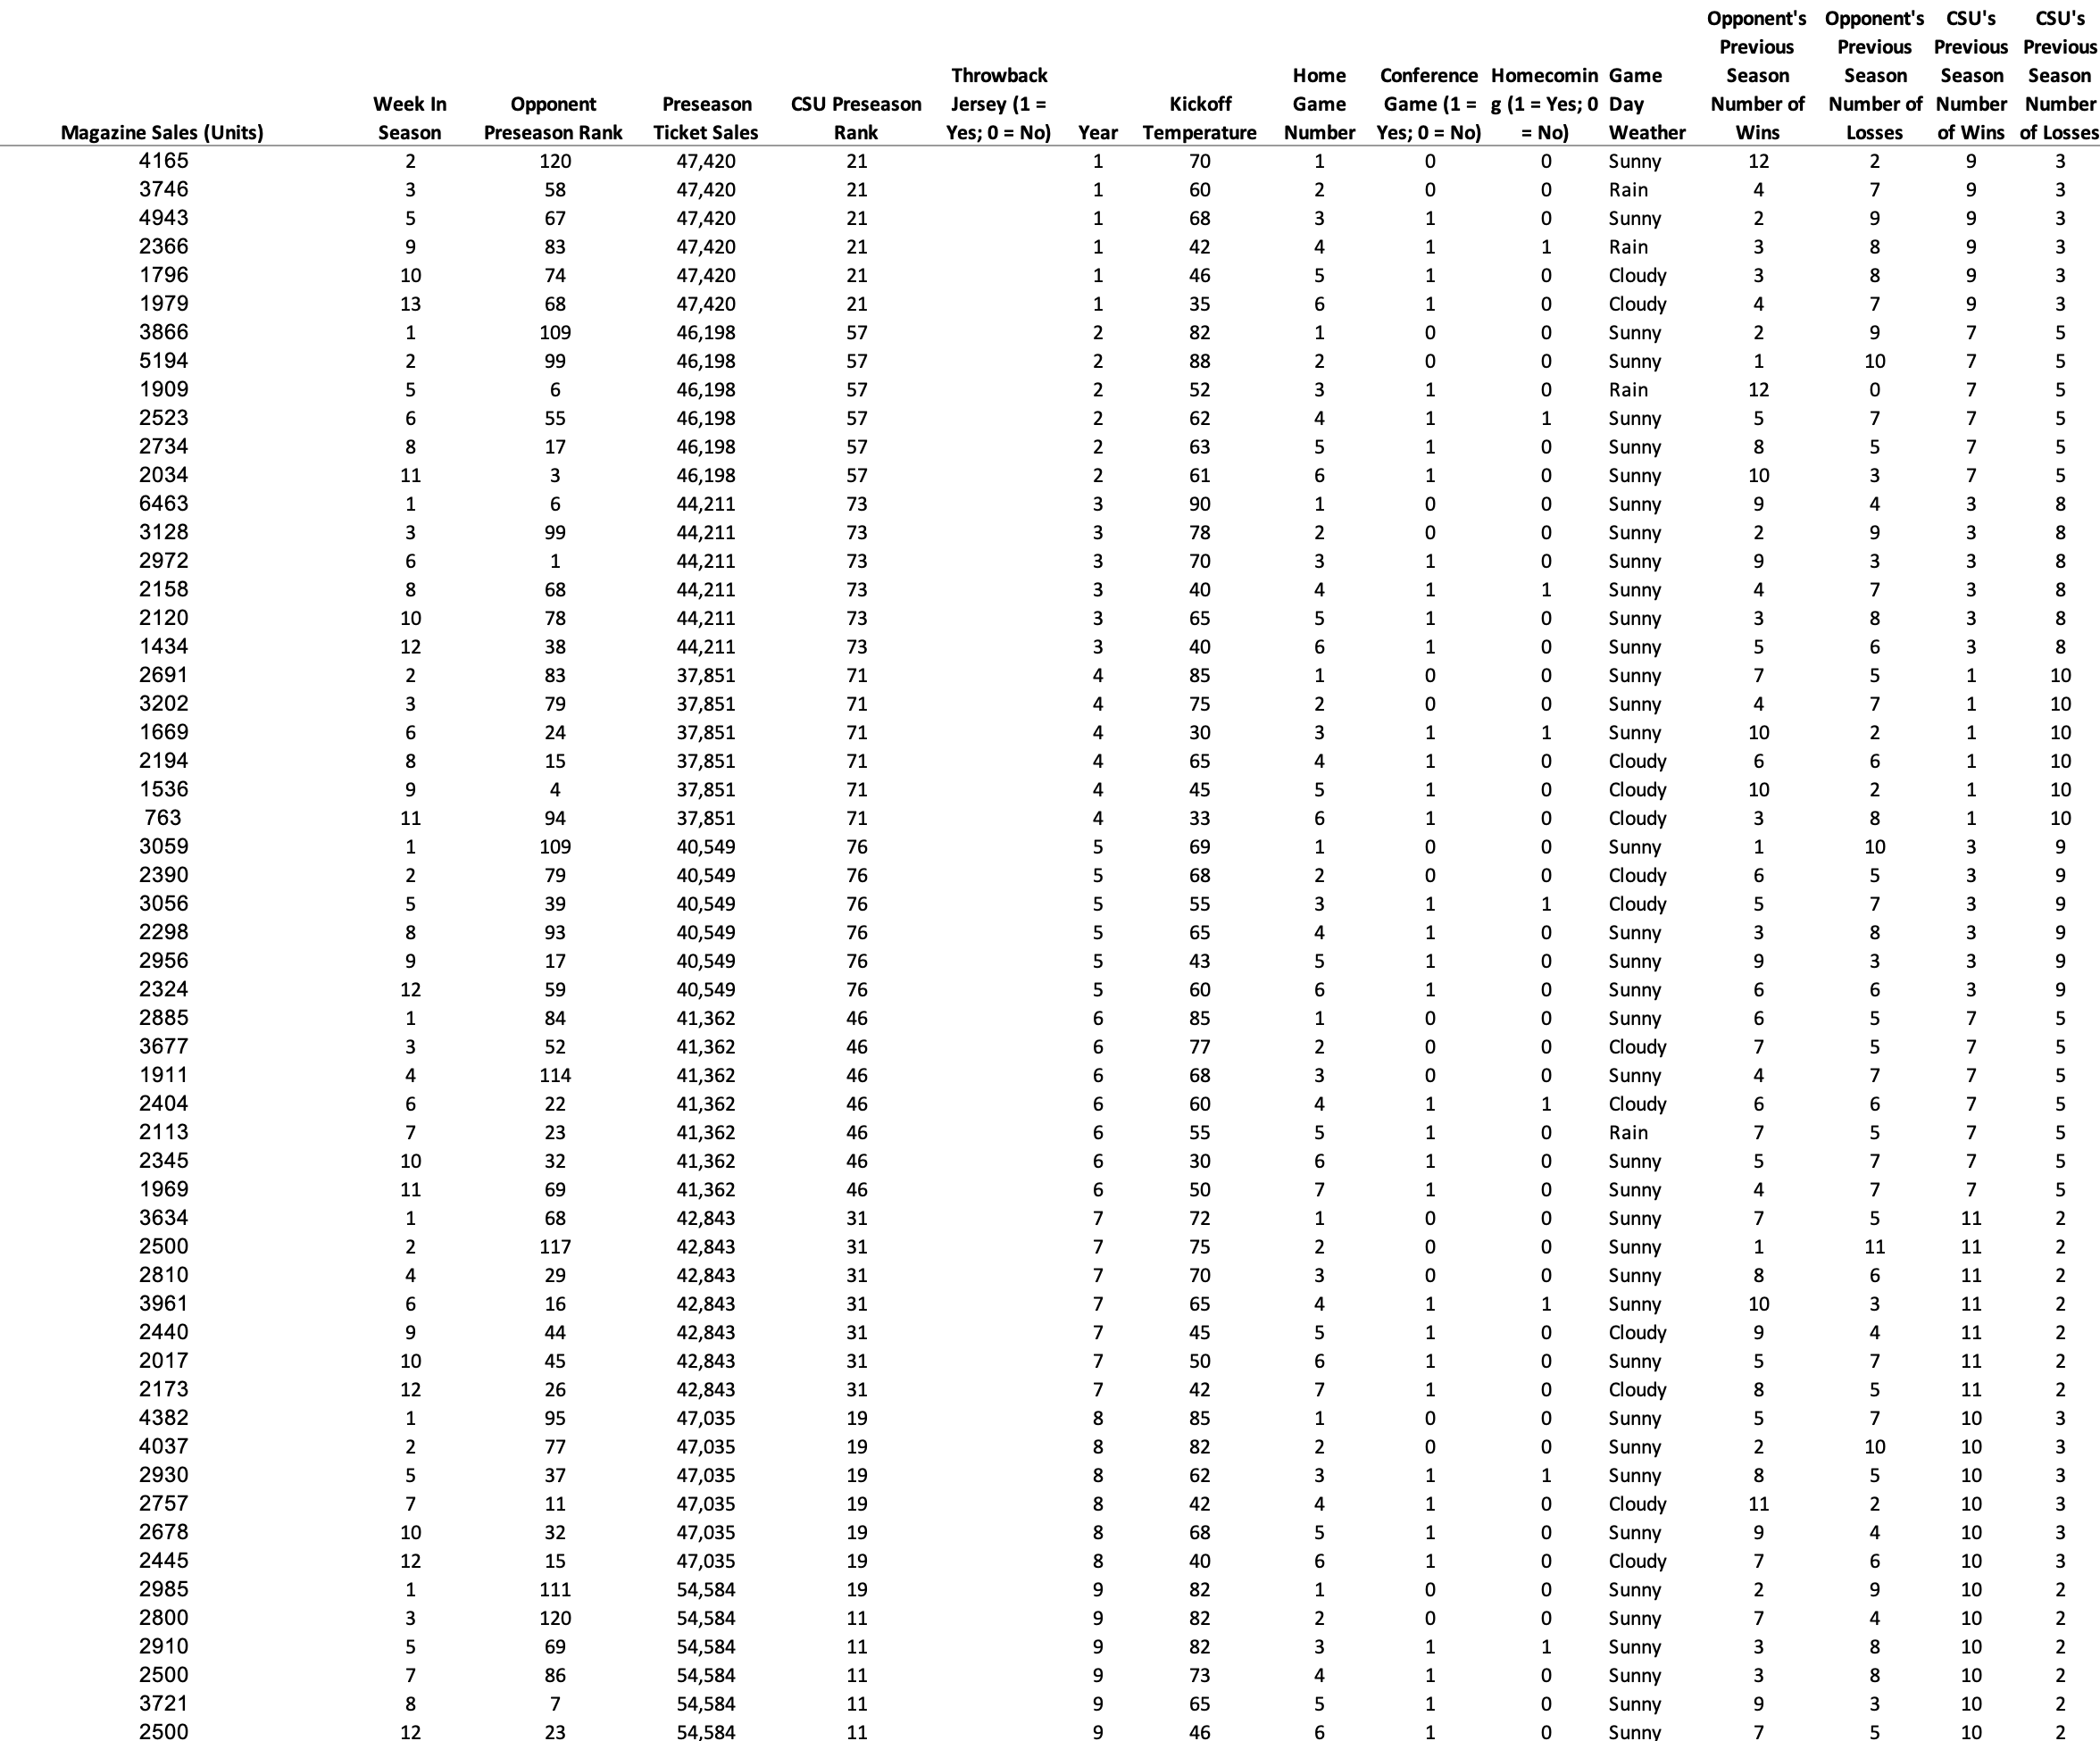
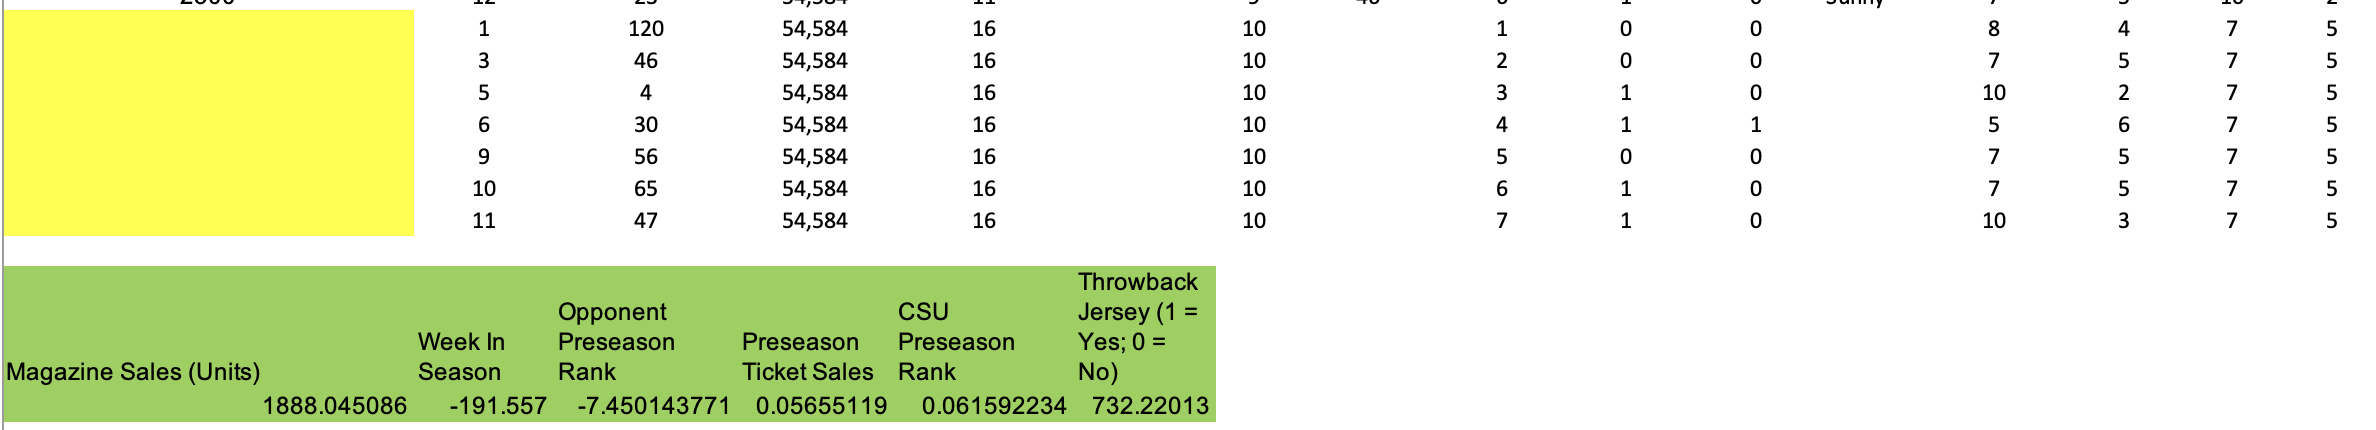
Question: Use the regression model to make predictions for Year 10. Note that the regression model coefficients are stored below the data table, highlighted in green.
Use the regression model to make predictions for Year 10. Note that the regression model coefficients are stored below the data table, highlighted in green.
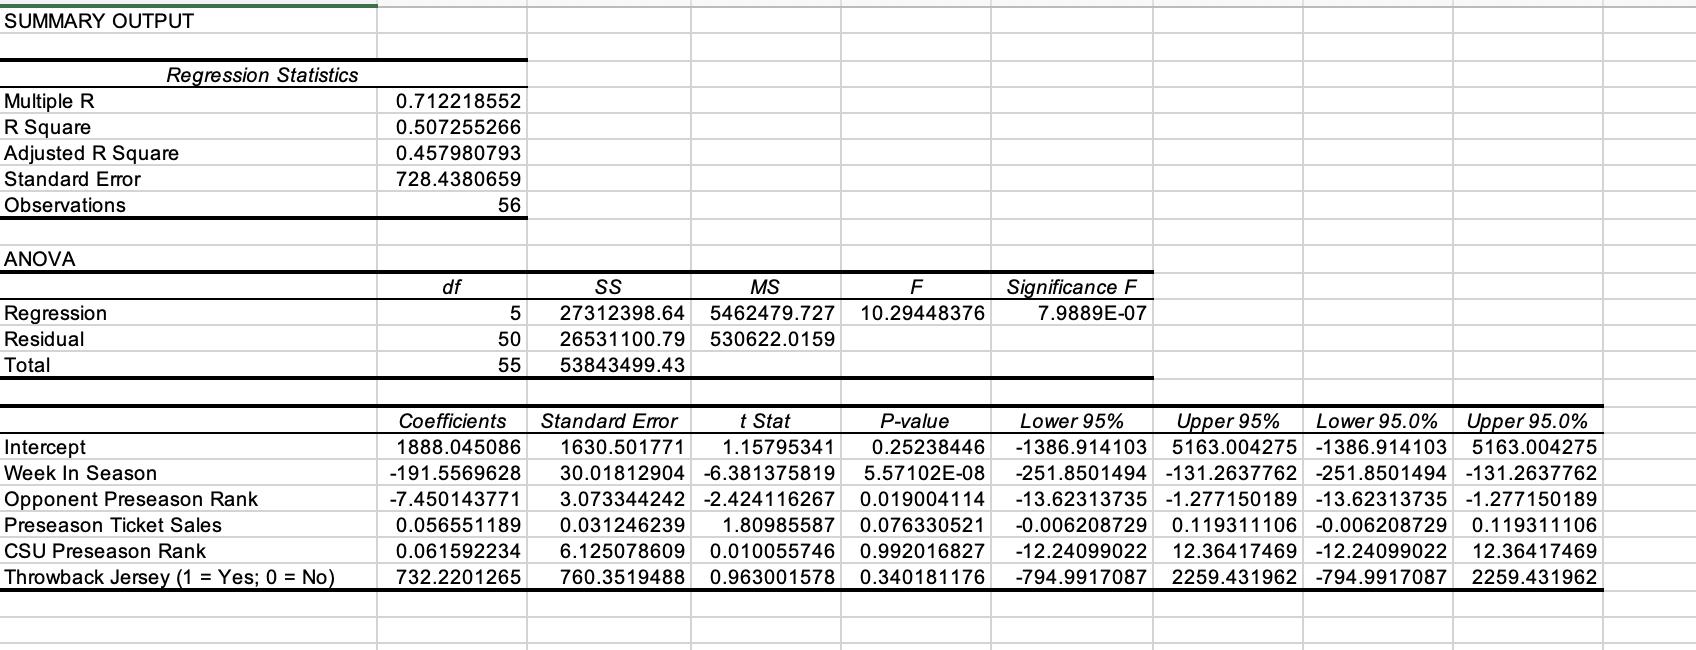
\begin{tabular}{|c|c|c|c|c|c|c|c|c|} \hline \multicolumn{9}{|l|}{ SUMMARY OUTPUT } \\ \hline \multicolumn{9}{|l|}{ Regression Statistics } \\ \hline Multiple R & 0.712218552 & & & & & & & \\ \hline R Square & 0.507255266 & & & & & & & \\ \hline Adjusted R Square & 0.457980793 & & & & & & & \\ \hline Standard Error & 728.4380659 & & & & & & & \\ \hline Observations & 56 & & & & & & & \\ \hline \multicolumn{9}{|l|}{ ANOVA } \\ \hline & df & SS & MS & F & Significance F & & & \\ \hline Regression & 5 & 27312398.64 & 5462479.727 & 10.29448376 & 7.9889E07 & & & \\ \hline Residual & 50 & 26531100.79 & 530622.0159 & & & & & \\ \hline \multirow[t]{2}{*}{ Total } & 55 & 53843499.43 & & & & & & \\ \hline & Coefficients & Standard Error & t Stat & P-value & Lower 95\% & Upper 95% & Lower 95.0% & Upper 95.0% \\ \hline Intercept & 1888.045086 & 1630.501771 & 1.15795341 & 0.25238446 & -1386.914103 & 5163.004275 & -1386.914103 & 5163.004275 \\ \hline Week In Season & -191.5569628 & 30.01812904 & -6.381375819 & 5.57102E08 & -251.8501494 & -131.2637762 & -251.8501494 & -131.2637762 \\ \hline Opponent Preseason Rank & -7.450143771 & 3.073344242 & -2.424116267 & 0.019004114 & -13.62313735 & -1.277150189 & -13.62313735 & -1.277150189 \\ \hline Preseason Ticket Sales & 0.056551189 & 0.031246239 & 1.80985587 & 0.076330521 & -0.006208729 & 0.119311106 & -0.006208729 & 0.119311106 \\ \hline CSU Preseason Rank & 0.061592234 & 6.125078609 & 0.010055746 & 0.992016827 & -12.24099022 & 12.36417469 & -12.24099022 & 12.36417469 \\ \hline Throwback Jersey (1= Yes; 0= No) & 732.2201265 & 760.3519488 & 0.963001578 & 0.340181176 & -794.9917087 & 2259.431962 & -794.9917087 & 2259.431962 \\ \hline \end{tabular}
Step by Step Solution
There are 3 Steps involved in it

Get step-by-step solutions from verified subject matter experts