

Question: Use the same data as in the previous problem (MVIDIA Corporation), HW 5-2. a) Create a scatter chart of research and development vs. sales (YEAR
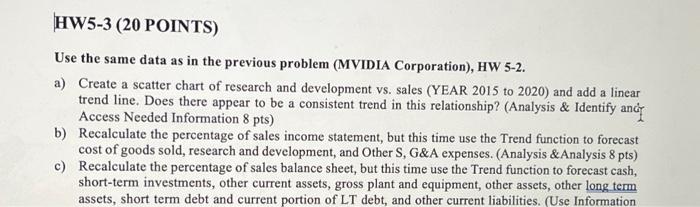
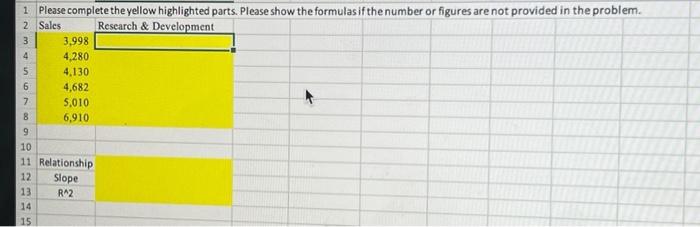
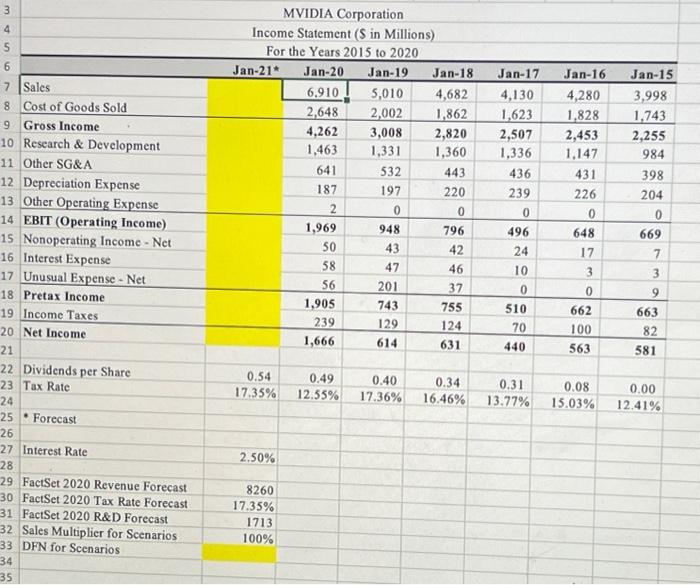
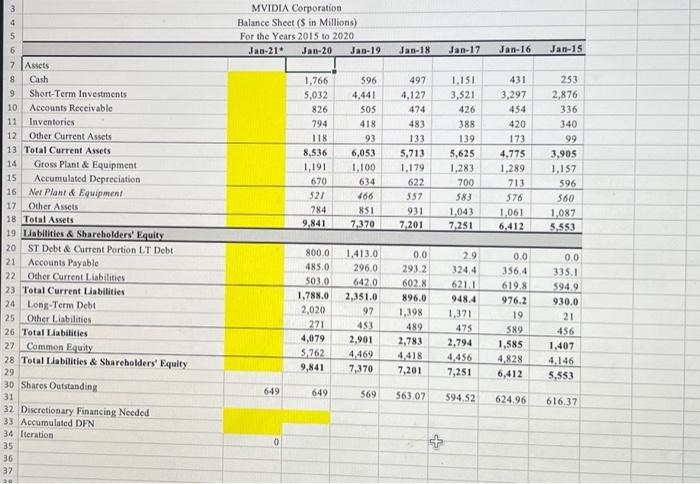
Use the same data as in the previous problem (MVIDIA Corporation), HW 5-2. a) Create a scatter chart of research and development vs. sales (YEAR 2015 to 2020) and add a linear trend line. Does there appear to be a consistent trend in this relationship? (Analysis \& Identify anci Access Needed Information 8 pts) b) Recalculate the percentage of sales income statement, but this time use the Trend function to forecast cost of goods sold, research and development, and Other S, G\&A expenses. (Analysis \&Analysis 8 pts) c) Recalculate the percentage of sales balance sheet, but this time use the Trend function to forecast cash, short-term investments, other current assets, gross plant and equipment, other assets, other long term assets, short term debt and current portion of LT debt, and other current liabilities. (Use Information 1 Please complete the yellow highlighted parts. Please show the formulas if the number or figures are not provided in the problem. Sales Research \& Development \begin{tabular}{|l|} 3,998 \\ 4,280 \\ 4,130 \\ 4,682 \\ 5,010 \\ 6,910 \end{tabular} Relationship Slope R^2 \begin{tabular}{|c|c|c|c|c|c|c|c|} \hline \multicolumn{8}{|c|}{ MVIDIA Corporation } \\ \hline \multicolumn{8}{|c|}{ Income Statement ( $ in Millions) } \\ \hline \multicolumn{8}{|c|}{ For the Years 2015 to 2020} \\ \hline & Jan-21* & Jan-20 & Jan-19 & Jan-18 & Jan-17 & Jan-16 & Jan-15 \\ \hline Sales & & 6.910 & 5,010 & 4,682 & 4,130 & 4,280 & 3,998 \\ \hline Cost of Goods Sold & & 2,648 & 2,002 & 1,862 & 1,623 & 1,828 & 1,743 \\ \hline Gross Income & & 4,262 & 3,008 & 2,820 & 2,507 & 2,453 & 2,255 \\ \hline Research \& Development & & 1,463 & 1,331 & 1,360 & 1,336 & 1,147 & 984 \\ \hline 1 Other SG\&A & & 641 & 532 & 443 & 436 & 431 & 398 \\ \hline 2 Depreciation Expense & & 187 & 197 & 220 & 239 & 226 & 204 \\ \hline 3 Other Operating Expense & & 2 & 0 & 0 & 0 & 0 & 0 \\ \hline EBIT (Operating Income) & & 1,969 & 948 & 796 & 496 & 648 & 669 \\ \hline Nonoperating Income - Net & & 50 & 43 & 42 & 24 & 17 & 7 \\ \hline Interest Expense & & 58 & 47 & 46 & 10 & 3 & 3 \\ \hline Unusual Expense - Net & & 56 & 201 & 37 & 0 & 0 & 9 \\ \hline Pretax Income & & 1,905 & 743 & 755 & 510 & 662 & 663 \\ \hline Income Taxes & & 239 & 129 & 124 & 70 & 100 & 82 \\ \hline Net Income & & 1,666 & 614 & 631 & 440 & 563 & 581 \\ \hline & & & & & & & \\ \hline Dividends per Share & 0.54 & 0.49 & 0.40 & 0.34 & 0.31 & 0.08 & 0.00 \\ \hline Tax Rate & 17.35% & 12.55% & 17.36% & 16.46% & 13.77% & 15.03% & 12.41% \\ \hline & 4 & & & & & & \\ \hline - Forecast & & & & & & & \\ \hline If & & E & & & & en & \\ \hline Interest Rate & 2.50% & & & & & & \\ \hline & & & & & & & \\ \hline FactSet 2020 Revenue Forecast & 8260 & & & & & & \\ \hline FactSet 2020 Tax Rate Forecast & 17.35% & & & & & + & \\ \hline FactSet 2020 R\&D Forecast & 1713 & & & & & & \\ \hline Sales Multiplier for Scenarios & 100% & & & & & & \\ \hline DFN for Scenarios & & & & & & & \\ \hline \end{tabular} MVIDIA Corporation Balance Sheet ( $ in Millions) For the Years 2015 to 2020 \begin{tabular}{|c|c|c|c|c|c|c|c|} \hline & Jan21 & Jan-20 & Jan-19 & Jan18 & Jan17 & Jan16 & Jan-15 \\ \hline \multicolumn{8}{|l|}{ Assets } \\ \hline Cash & & 1,766 & 596 & 497 & 1,151 & 431 & 253 \\ \hline Short-Term Investments & & 5,032 & 4,441 & 4,127 & 3,521 & 3,297 & 2,876 \\ \hline Accounts Reccivable & & 826 & 505 & 474 & 426 & 454 & 336 \\ \hline Inventorics & & 794 & 418 & 483 & 388 & 420 & 340 \\ \hline Other Current Assets & & 118 & 93 & 133 & 139 & 173 & 99 \\ \hline Total Current Assets & & 8,536 & 6,053 & 5,713 & 5,625 & 4,775 & 3,905 \\ \hline Gross Plant \& Equipment & & 1,191 & 1,100 & 1,179 & 1,283 & 1,289 & 1,157 \\ \hline Accumulated Depreciation & & 670 & 634 & 622 & 700 & 713 & 596 \\ \hline Net Plant \& Equipment & & 521 & 466 & 557 & 583 & 576 & 560 \\ \hline Other Assets & & 784 & 851 & 931 & 1,043 & 1,061 & 1,087 \\ \hline Total Assets & & 9.841 & 7,370 & 7,201 & 7,251 & 6,412 & 5,553 \\ \hline \multicolumn{8}{|l|}{ Labilities \& Shareholders' Equity } \\ \hline ST Debt \& Current Portion LT Debt & & 800.0 & 1,413.0 & 0.0 & 2.9 & 0.0 & 0.0 \\ \hline Accounts Payable & & 485.0 & 296.0 & 293.2 & 324.4 & 356.4 & 335.1 \\ \hline Other Current Liabilities & & 503.0 & 642.0 & 602.8 & 621.1 & 619.8 & 594.9 \\ \hline Tetal Curreat Liabilities & & 1,788.0 & 2,351,0 & 896.0 & 948.4 & 976.2 & 930.0 \\ \hline Long-Term Debt & & 2,020 & 97 & 1,398 & 1,371 & 19 & 21 \\ \hline Other Liabilities & & 271 & 453 & 489 & 475 & 589 & 456 \\ \hline Total Labitities & & 4,079 & 2,901 & 2,783 & 2,794 & 1,585 & 1,407 \\ \hline Common Equity & & 5,762 & 4,469 & 4,418 & 4,456 & 4,828 & 4,146 \\ \hline Total Labilities \& Shareholders' Equity & & 9,841 & 7,370 & 7,201 & 7,251 & 6,412 & 5,553 \\ \hline & & & & & & & \\ \hline Shares Outstanding & 649 & 649 & 569 & 563.07 & 594.52 & 624.96 & 616.37 \\ \hline \multirow{2}{*}{\multicolumn{8}{|c|}{ Discretionary Financing Needed }} \\ \hline \multicolumn{6}{|l|}{ Accumulated DFN } & & \\ \hline Iteration & 0 & & & & & & \\ \hline \end{tabular} Use the same data as in the previous problem (MVIDIA Corporation), HW 5-2. a) Create a scatter chart of research and development vs. sales (YEAR 2015 to 2020) and add a linear trend line. Does there appear to be a consistent trend in this relationship? (Analysis \& Identify anci Access Needed Information 8 pts) b) Recalculate the percentage of sales income statement, but this time use the Trend function to forecast cost of goods sold, research and development, and Other S, G\&A expenses. (Analysis \&Analysis 8 pts) c) Recalculate the percentage of sales balance sheet, but this time use the Trend function to forecast cash, short-term investments, other current assets, gross plant and equipment, other assets, other long term assets, short term debt and current portion of LT debt, and other current liabilities. (Use Information 1 Please complete the yellow highlighted parts. Please show the formulas if the number or figures are not provided in the problem. Sales Research \& Development \begin{tabular}{|l|} 3,998 \\ 4,280 \\ 4,130 \\ 4,682 \\ 5,010 \\ 6,910 \end{tabular} Relationship Slope R^2 \begin{tabular}{|c|c|c|c|c|c|c|c|} \hline \multicolumn{8}{|c|}{ MVIDIA Corporation } \\ \hline \multicolumn{8}{|c|}{ Income Statement ( $ in Millions) } \\ \hline \multicolumn{8}{|c|}{ For the Years 2015 to 2020} \\ \hline & Jan-21* & Jan-20 & Jan-19 & Jan-18 & Jan-17 & Jan-16 & Jan-15 \\ \hline Sales & & 6.910 & 5,010 & 4,682 & 4,130 & 4,280 & 3,998 \\ \hline Cost of Goods Sold & & 2,648 & 2,002 & 1,862 & 1,623 & 1,828 & 1,743 \\ \hline Gross Income & & 4,262 & 3,008 & 2,820 & 2,507 & 2,453 & 2,255 \\ \hline Research \& Development & & 1,463 & 1,331 & 1,360 & 1,336 & 1,147 & 984 \\ \hline 1 Other SG\&A & & 641 & 532 & 443 & 436 & 431 & 398 \\ \hline 2 Depreciation Expense & & 187 & 197 & 220 & 239 & 226 & 204 \\ \hline 3 Other Operating Expense & & 2 & 0 & 0 & 0 & 0 & 0 \\ \hline EBIT (Operating Income) & & 1,969 & 948 & 796 & 496 & 648 & 669 \\ \hline Nonoperating Income - Net & & 50 & 43 & 42 & 24 & 17 & 7 \\ \hline Interest Expense & & 58 & 47 & 46 & 10 & 3 & 3 \\ \hline Unusual Expense - Net & & 56 & 201 & 37 & 0 & 0 & 9 \\ \hline Pretax Income & & 1,905 & 743 & 755 & 510 & 662 & 663 \\ \hline Income Taxes & & 239 & 129 & 124 & 70 & 100 & 82 \\ \hline Net Income & & 1,666 & 614 & 631 & 440 & 563 & 581 \\ \hline & & & & & & & \\ \hline Dividends per Share & 0.54 & 0.49 & 0.40 & 0.34 & 0.31 & 0.08 & 0.00 \\ \hline Tax Rate & 17.35% & 12.55% & 17.36% & 16.46% & 13.77% & 15.03% & 12.41% \\ \hline & 4 & & & & & & \\ \hline - Forecast & & & & & & & \\ \hline If & & E & & & & en & \\ \hline Interest Rate & 2.50% & & & & & & \\ \hline & & & & & & & \\ \hline FactSet 2020 Revenue Forecast & 8260 & & & & & & \\ \hline FactSet 2020 Tax Rate Forecast & 17.35% & & & & & + & \\ \hline FactSet 2020 R\&D Forecast & 1713 & & & & & & \\ \hline Sales Multiplier for Scenarios & 100% & & & & & & \\ \hline DFN for Scenarios & & & & & & & \\ \hline \end{tabular} MVIDIA Corporation Balance Sheet ( $ in Millions) For the Years 2015 to 2020 \begin{tabular}{|c|c|c|c|c|c|c|c|} \hline & Jan21 & Jan-20 & Jan-19 & Jan18 & Jan17 & Jan16 & Jan-15 \\ \hline \multicolumn{8}{|l|}{ Assets } \\ \hline Cash & & 1,766 & 596 & 497 & 1,151 & 431 & 253 \\ \hline Short-Term Investments & & 5,032 & 4,441 & 4,127 & 3,521 & 3,297 & 2,876 \\ \hline Accounts Reccivable & & 826 & 505 & 474 & 426 & 454 & 336 \\ \hline Inventorics & & 794 & 418 & 483 & 388 & 420 & 340 \\ \hline Other Current Assets & & 118 & 93 & 133 & 139 & 173 & 99 \\ \hline Total Current Assets & & 8,536 & 6,053 & 5,713 & 5,625 & 4,775 & 3,905 \\ \hline Gross Plant \& Equipment & & 1,191 & 1,100 & 1,179 & 1,283 & 1,289 & 1,157 \\ \hline Accumulated Depreciation & & 670 & 634 & 622 & 700 & 713 & 596 \\ \hline Net Plant \& Equipment & & 521 & 466 & 557 & 583 & 576 & 560 \\ \hline Other Assets & & 784 & 851 & 931 & 1,043 & 1,061 & 1,087 \\ \hline Total Assets & & 9.841 & 7,370 & 7,201 & 7,251 & 6,412 & 5,553 \\ \hline \multicolumn{8}{|l|}{ Labilities \& Shareholders' Equity } \\ \hline ST Debt \& Current Portion LT Debt & & 800.0 & 1,413.0 & 0.0 & 2.9 & 0.0 & 0.0 \\ \hline Accounts Payable & & 485.0 & 296.0 & 293.2 & 324.4 & 356.4 & 335.1 \\ \hline Other Current Liabilities & & 503.0 & 642.0 & 602.8 & 621.1 & 619.8 & 594.9 \\ \hline Tetal Curreat Liabilities & & 1,788.0 & 2,351,0 & 896.0 & 948.4 & 976.2 & 930.0 \\ \hline Long-Term Debt & & 2,020 & 97 & 1,398 & 1,371 & 19 & 21 \\ \hline Other Liabilities & & 271 & 453 & 489 & 475 & 589 & 456 \\ \hline Total Labitities & & 4,079 & 2,901 & 2,783 & 2,794 & 1,585 & 1,407 \\ \hline Common Equity & & 5,762 & 4,469 & 4,418 & 4,456 & 4,828 & 4,146 \\ \hline Total Labilities \& Shareholders' Equity & & 9,841 & 7,370 & 7,201 & 7,251 & 6,412 & 5,553 \\ \hline & & & & & & & \\ \hline Shares Outstanding & 649 & 649 & 569 & 563.07 & 594.52 & 624.96 & 616.37 \\ \hline \multirow{2}{*}{\multicolumn{8}{|c|}{ Discretionary Financing Needed }} \\ \hline \multicolumn{6}{|l|}{ Accumulated DFN } & & \\ \hline Iteration & 0 & & & & & & \\ \hline \end{tabular}
Step by Step Solution
There are 3 Steps involved in it

Get step-by-step solutions from verified subject matter experts