

Question: Use the same scales to construct modified boxplots for the pulse rates of males and females from the accompanying data sets. Identify any outliers.

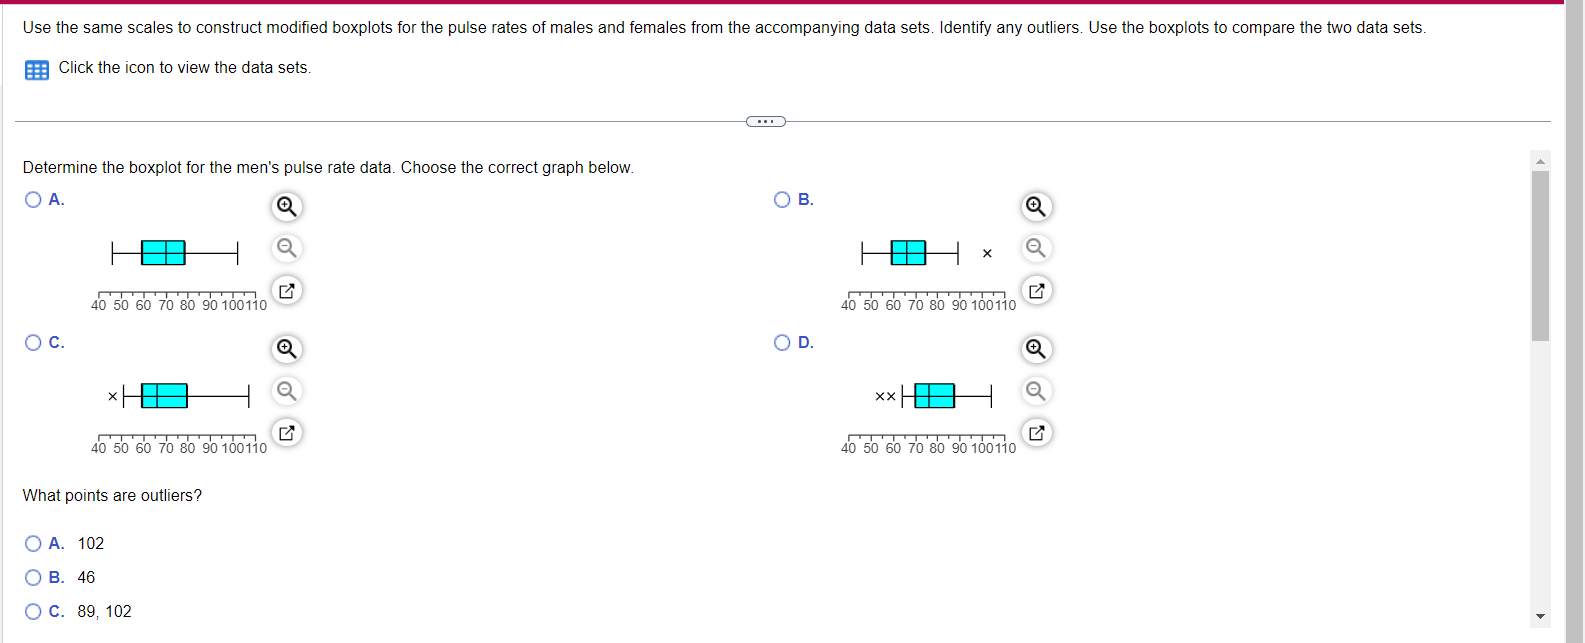
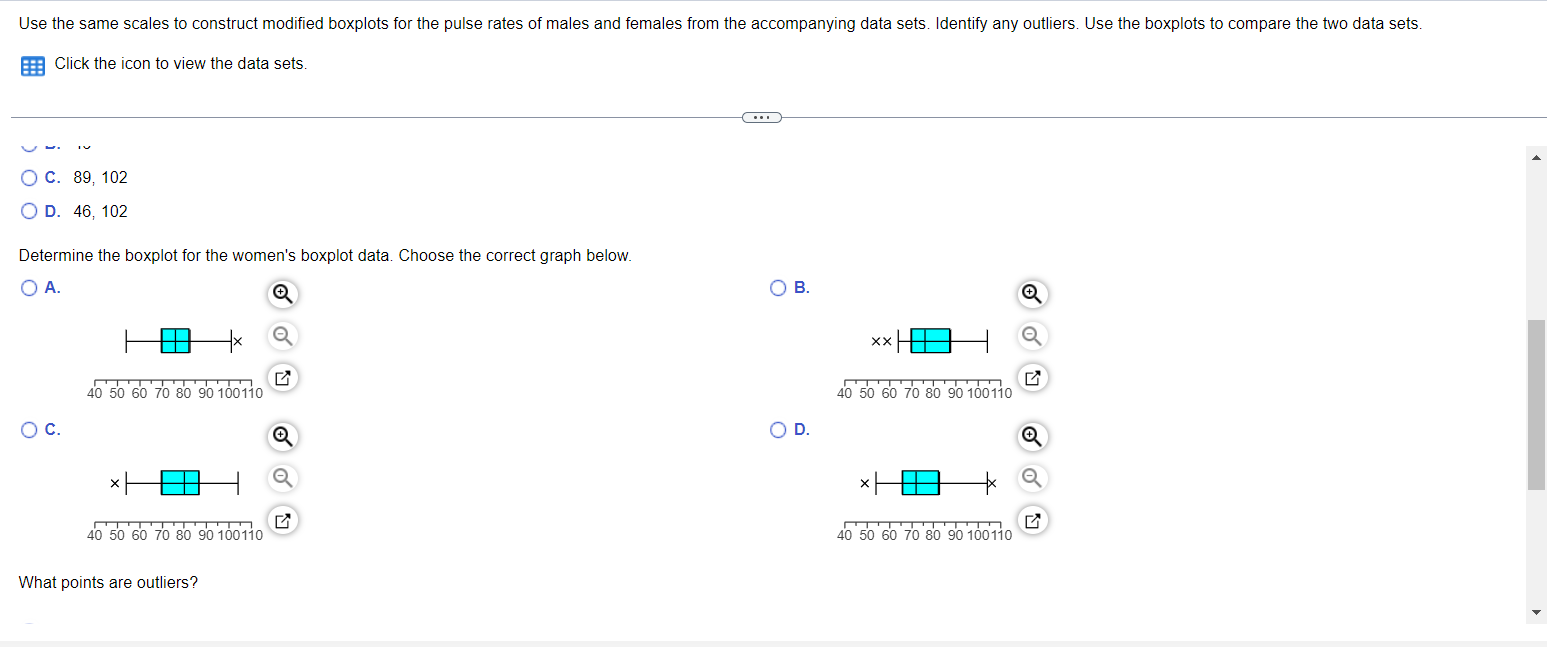
Use the same scales to construct modified boxplots for the pulse rates of males and females from the accompanying data sets. Identify any outliers. Use the boxplots to compare the two data sets. Click the icon to view the data sets. 40 50 60 70 80 90 100110 What points are outliers? A. 54, 61, 104 OB. 101, 104 OC. 54, 101, 104 D. 104 Compare the two boxplots. Choose the correct answer below. 40 50 60 70 80 90 100110 A. In general, it appears that males have higher pulse rates than females. The variation among the male pulse rates is similar to the variation among the female pulse rates. B. In general, it appears that males have higher pulse rates than females. The variation among the male pulse rates is much greater than the variation among the female pulse rates. C. In general, it appears that males have lower pulse rates than females. The variation among the male pulse rates is much greater than the variation among the female pulse rates. D. In general, it appears that males have lower pulse rates than females. The variation among the male pulse rates is similar to the variation among the female pulse rates. Use the same scales to construct modified boxplots for the pulse rates of males and females from the accompanying data sets. Identify any outliers. Use the boxplots to compare the two data sets. Click the icon to view the data sets. Determine the boxplot for the men's pulse rate data. Choose the correct graph below. A. C. 40 50 60 70 80 90 100110 H 40 50 60 70 80 90 100110 What points are outliers? A. 102 B. 46 C. 89, 102 B. 40 50 60 70 80 90 100110 D. 40 50 60 70 80 90 100110 Use the same scales to construct modified boxplots for the pulse rates of males and females from the accompanying data sets. Identify any outliers. Use the boxplots to compare the two data sets. Click the icon to view the data sets. IV C. 89, 102 O D. 46, 102 Determine the boxplot for the women's boxplot data. Choose the correct graph below. A. C. 40 50 60 70 80 90 100110 40 50 60 70 80 90 100110 What points are outliers? B. D. XX 40 50 60 70 80 90 100110 40 50 60 70 80 90 100110
Step by Step Solution
There are 3 Steps involved in it

Get step-by-step solutions from verified subject matter experts