

Question: Use the sample data and confidence level given below to complete parts?(a) through?(d). Positive z Scores Standard Normal (z) Distribution: Cumulative Area from the Left
Use the sample data and confidence level given below to complete parts?(a) through?(d).
Positive z Scores
Standard Normal (z) Distribution: Cumulative Area from the Left
z .00 .01 .02 .03 .04 .05 .06 .07 .08 .09 z
0.0 .5000 .5040 .5080 .5120 .5160 .5199 .5239 .5279 .5319 .5359 0.0
0.1 .5398 .5438 .5478 .5517 .5557 .5596 .5636 .5675 .5714 .5753 0.1
0.2 .5793 .5832 .5871 .5910 .5948 .5987 .6026 .6064 .6103 .6141 0.2
0.3 .6179 .6217 .6255 .6293 .6331 .6368 .6406 .6443 .6480 .6517 0.3
0.4 .6554 .6591 .6628 .6664 .6700 .6736 .6772 .6808 .6844 .6879 0.4
0.5 .6915 .6950 .6985 .7019 .7054 .7088 .7123 .7157 .7190 .7224 0.5
0.6 .7257 .7291 .7324 .7357 .7389 .7422 .7454 .7486 .7517 .7549 0.6
0.7 .7580 .7611 .7642 .7673 .7704 .7734 .7764 .7794 .7823 .7852 0.7
0.8 .7881 .7910 .7939 .7967 .7995 .8023 .8051 .8078 .8106 .8133 0.8
0.9 .8159 .8186 .8212 .8238 .8264 .8289 .8315 .8340 .8365 .8389 0.9
1.0 .8413 .8438 .8461 .8485 .8508 .8531 .8554 .8577 .8599 .8621 1.0
1.1 .8643 .8665 .8686 .8708 .8729 .8749 .8770 .8790 .8810 .8830 1.1
1.2 .8849 .8869 .8888 .8907 .8925 .8944 .8962 .8980 .8997 .9015 1.2
1.3 .9032 .9049 .9066 .9082 .9099 .9115 .9131 .9147 .9162 .9177 1.3
1.4 .9192 .9207 .9222 .9236 .9251 .9265 .9279 .9292 .9306 .9319 1.4
1.5 .9332 .9345 .9357 .9370 .9382 .9394 .9406 .9418 .9429 .9441 1.5
1.6 .9452 .9463 .9474 .9484 .9495 .9505 .9515 .9525 .9535 .9545 1.6
1.7 .9554 .9564 .9573 .9582 .9591 .9599 .9608 .9616 .9625 .9633 1.7
1.8 .9641 .9649 .9656 .9664 .9671 .9678 .9686 .9693 .9699 .9706 1.8
1.9 .9713 .9719 .9726 .9732 .9738 .9744 .9750 .9756 .9761 .9767 1.9
2.0 .9772 .9778 .9783 .9788 .9793 .9798 .9803 .9808 .9812 .9817 2.0
2.1 .9821 .9826 .9830 .9834 .9838 .9842 .9846 .9850 .9854 .9857 2.1
2.2 .9861 .9864 .9868 .9871 .9875 .9878 .9881 .9884 .9887 .9890 2.2
2.3 .9893 .9896 .9898 .9901 .9904 .9906 .9909 .9911 .9913 .9916 2.3
2.4 .9918 .9920 .9922 .9925 .9927 .9929 .9931 .9932 .9934 .9936 2.4
2.5 .9938 .9940 .9941 .9943 .9945 .9946 .9948 .9949 .9951 .9952 2.5
2.6 .9953 .9955 .9956 .9957 .9959 .9960 .9961 .9962 .9963 .9964 2.6
2.7 .9965 .9966 .9967 .9968 .9969 .9970 .9971 .9972 .9973 .9974 2.7
2.8 .9974 .9975 .9976 .9977 .9977 .9978 .9979 .9979 .9980 .9981 2.8
2.9 .9981 .9982 .9982 .9983 .9984 .9984 .9985 .9985 .9986 .9986 2.9
3.0 .9987 .9987 .9987 .9988 .9988 .9989 .9989 .9989 .9990 .9990 3.0
3.1 .9990 .9991 .9991 .9991 .9992 .9992 .9992 .9992 .9993 .9993 3.1
3.2 .9993 .9993 .9994 .9994 .9994 .9994 .9994 .9995 .9995 .9995 3.2
3.3 .9995 .9995 .9995 .9996 .9996 .9996 .9996 .9996 .9996 .9997 3.3
3.4 .9997 .9997 .9997 .9997 .9997 .9997 .9997 .9997 .9997 .9998 3.4
3.50 and up .9999 3.50 and up
z .00 .01 .02 .03 .04 .05 .06 .07 .08 .09 z
Note: For values of z above 3.49, use 0.9999 for the area.
*Use these common values that result from interpolation:
z score Area
1.645 0.9500
2.575 0.9950
Common Critical Values
Confidence Level Critical Value
0.90 1.645
0.95 1.96
0.99 2.575
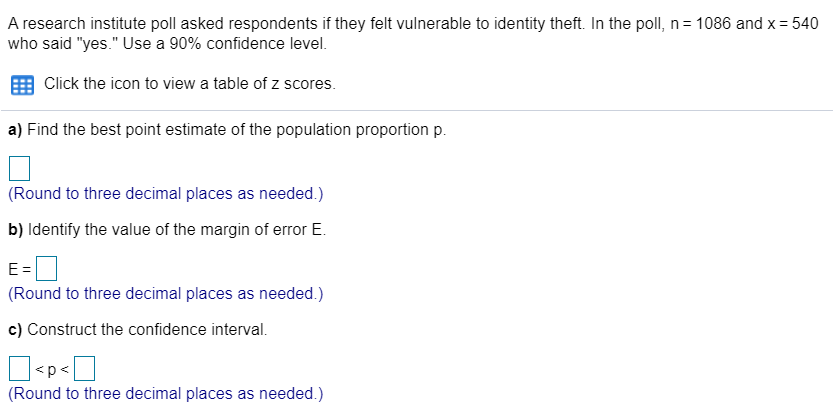
A research institute poll asked respondents if they felt vulnerable to identity theft. In the poll, n = 1086 and x = 540 who said "yes." Use a 90% confidence level. Click the icon to view a table of z scores. a) Find the best point estimate of the population proportion p. (Round to three decimal places as needed.) b) Identify the value of the margin of error E. E= (Round to three decimal places as needed.) c) Construct the confidence interval.
Step by Step Solution
There are 3 Steps involved in it

Get step-by-step solutions from verified subject matter experts