

Question: Use the sample data provided to: a. Compute 90% and 99% confidence intervals for the total assets held in the bank by loan applicants. b.
Use the sample data provided to:
a.Compute 90% and 99% confidence intervals for the total assets held in the bank by loan applicants.
b.Explain the differences with regards to the width of the intervals as the level of confidence increases.
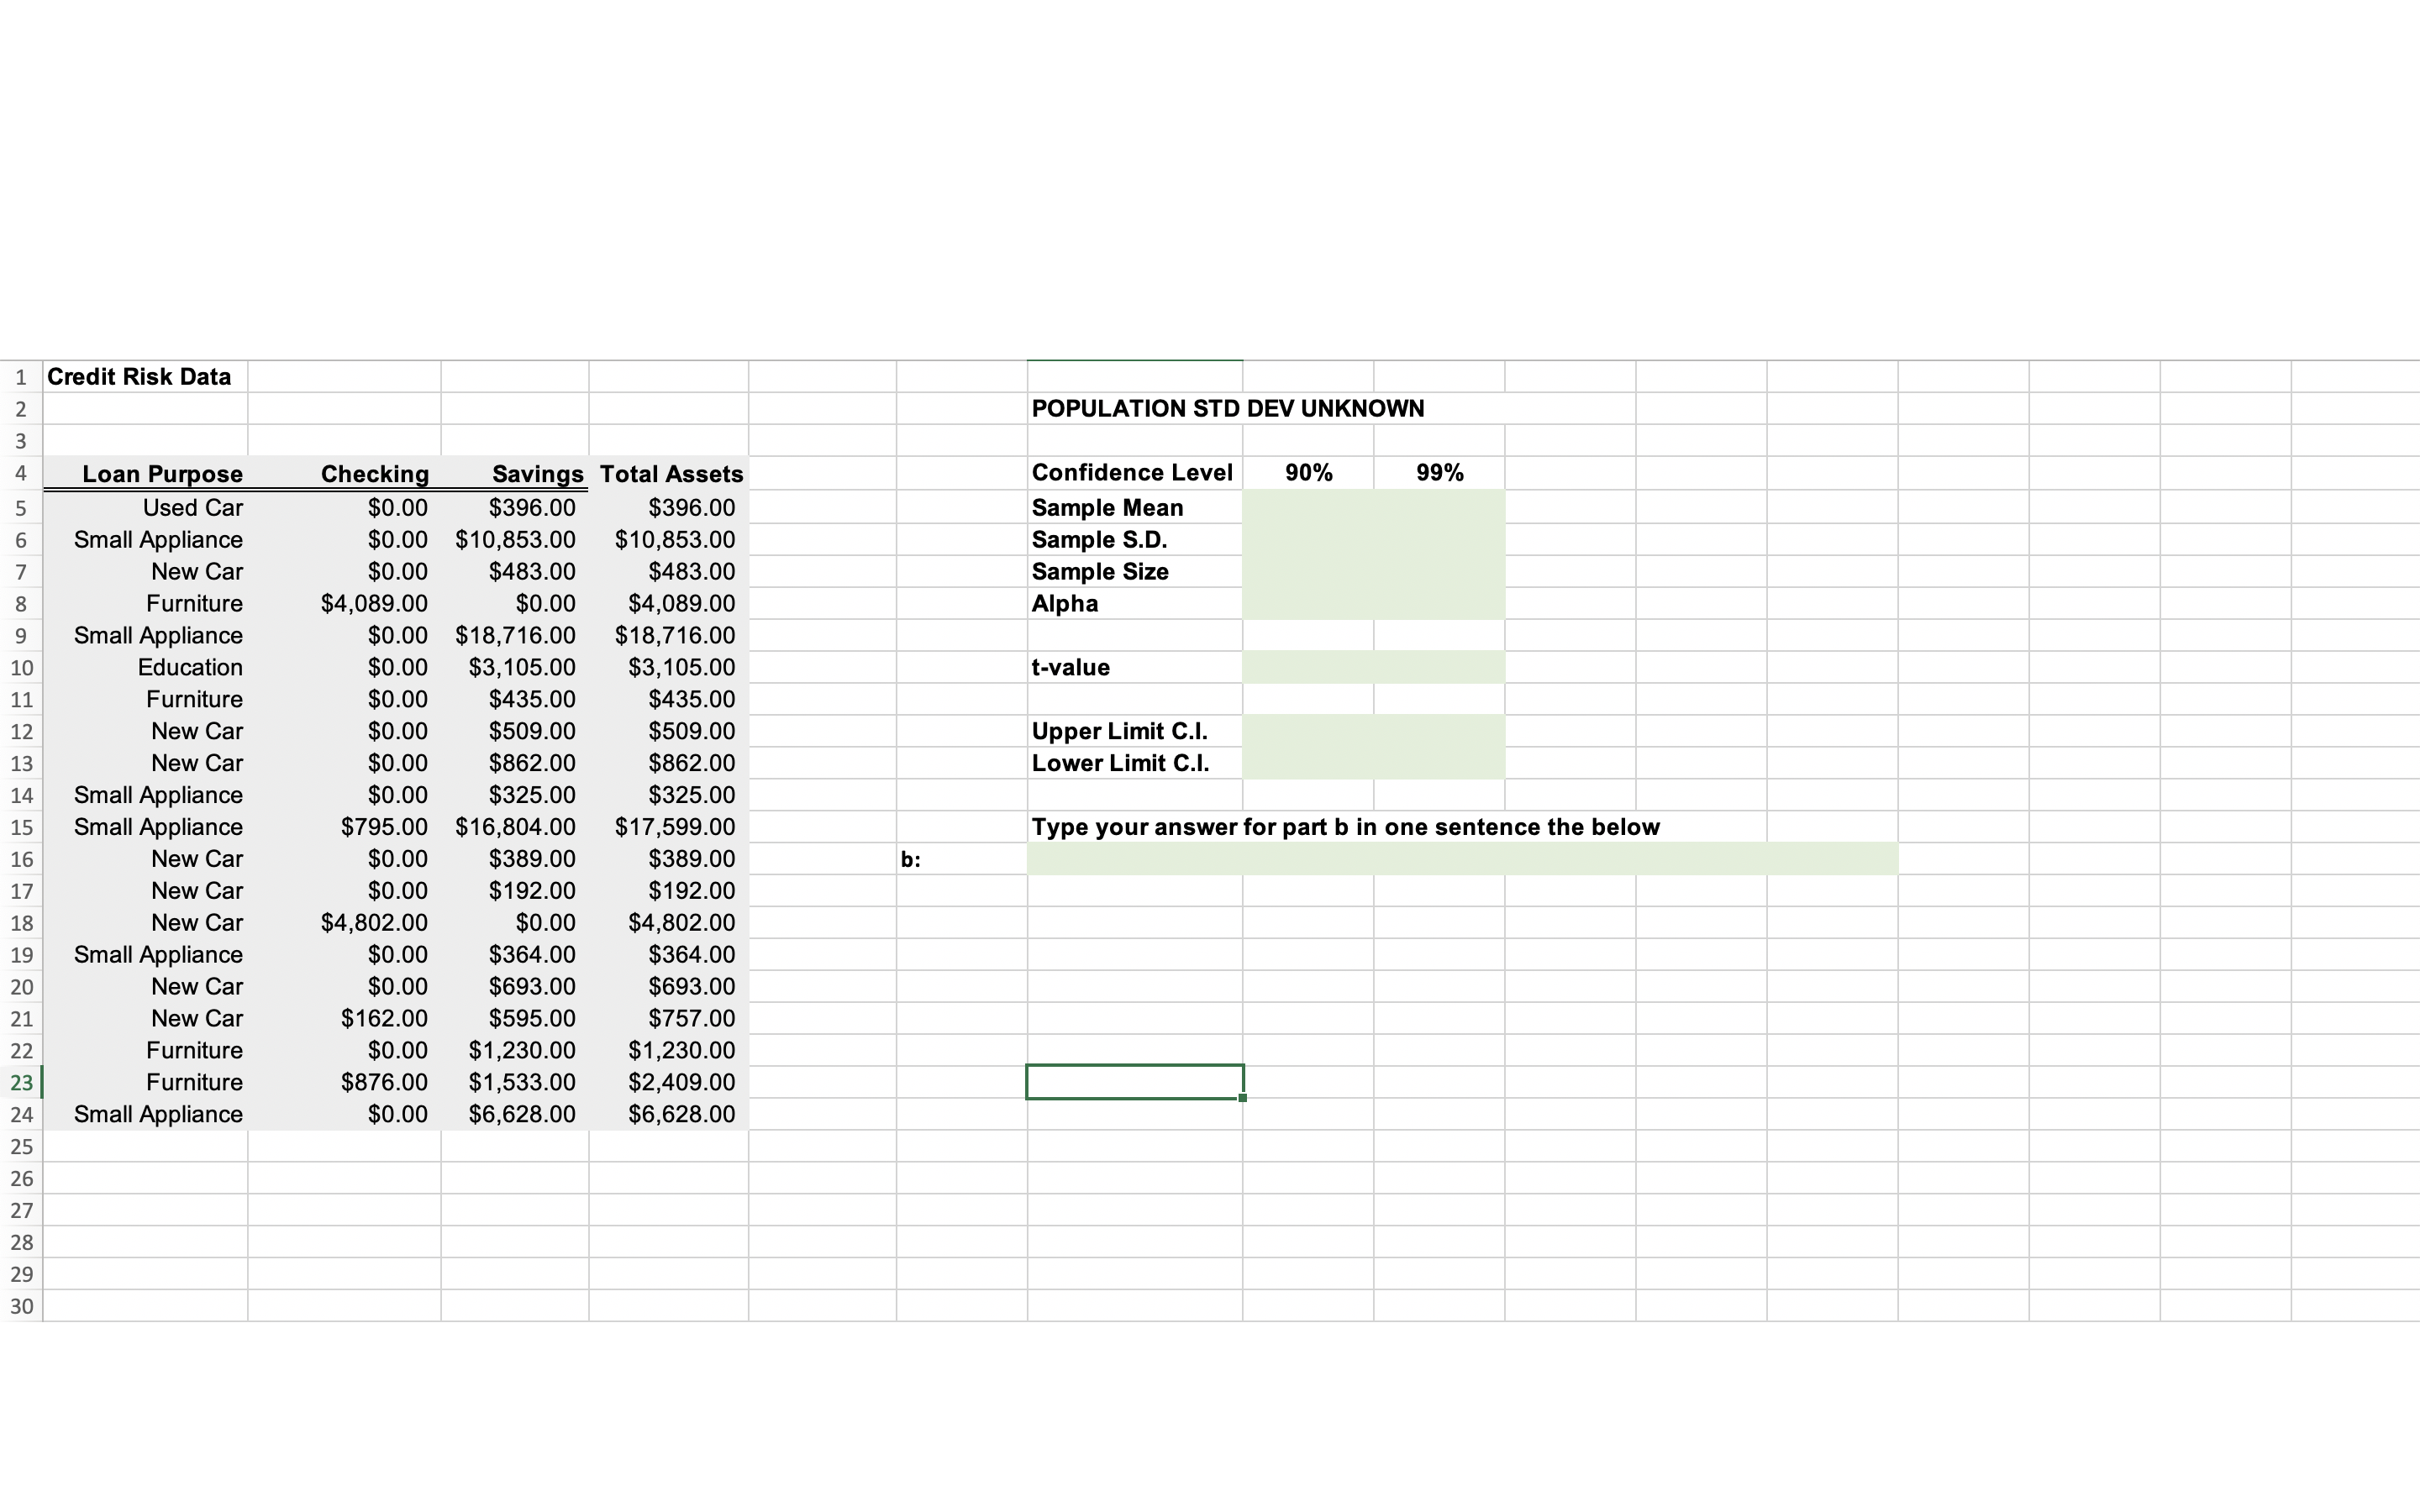
1 Credit Risk Data POPULATION STD DEV UNKNOWN 90% 99% OUT AWN Loan Purpose Checking Savings Total Assets Confidence Level 50.0 $396.00 $396.00 Sample Mean Used Car Small Appliance $0.00 $10,853.00 $10,853.00 Sample S.D. $0.00 $483.00 Sample Size New Car $483.00 Furniture $4,089.00 $0.00 $4,089.00 Alpha Small Appliance $0.00 $18,716.00 $18,716.00 Education $0.00 $3, 105.00 $3, 105.00 t-value 11 Furniture 50.00 $435.00 $435.00 New Car 60.00 $509.00 $509.00 Upper Limit C.I. 13 New Car $0.00 $862.00 $862.00 Lower Limit C.I. 14 Small Appliance 0.00 $325.00 $325.00 $795.00 $16,804.00 $17,599.00 Type your answer for part b in one sentence the below 15 Small Appliance New Car 50.00 $389.00 b: 16 $389.00 17 New Car $0.00 $192.00 $192.00 18 New Car $4,802.00 $0.00 $4,802.00 19 Small Appliance $0.00 $364.00 $364.00 20 New Car $0.00 $693.00 $693.00 21 New Car $162.00 $595.00 $757.00 22 Furniture $0.00 $1,230.00 $1,230.00 23 Furniture $876.00 $1,533.00 $2,409.00 24 Small Appliance $0.00 $6,628.00 $6,628.00 25 26 27 28 29 30
Step by Step Solution
There are 3 Steps involved in it

Get step-by-step solutions from verified subject matter experts