

Question: Use the sample sizes and the number of deviations determined below. Control Procedure 5 % 10 % Parameters Risk of incorrect acceptance Tolerable deviation rate
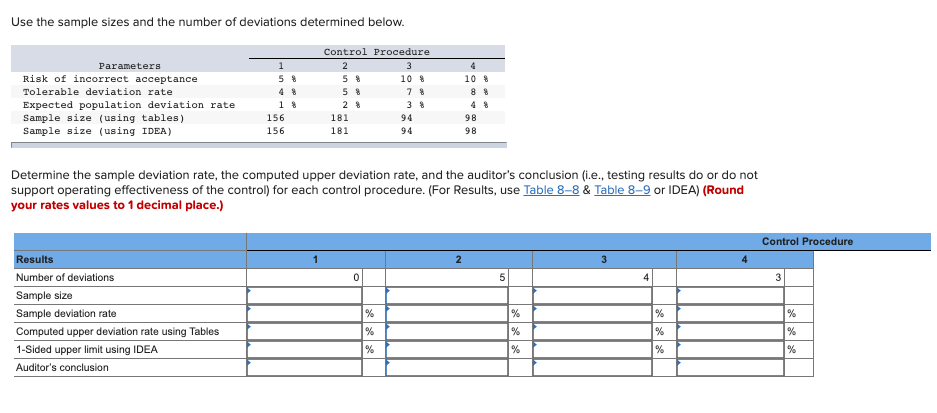
Use the sample sizes and the number of deviations determined below. Control Procedure 5 % 10 % Parameters Risk of incorrect acceptance Tolerable deviation rate Expected population deviation rate Sample size (using tables) Sample size (using IDEA) % % % 5 5 2 181 181 10 % 7 % 3% 94 % 1 156 156 98 Determine the sample deviation rate, the computed upper deviation rate, and the auditor's conclusion (i.e., testing results do or do not support operating effectiveness of the control) for each control procedure. (For Results, use Table 8-8 & Table 8-9 or IDEA) (Round your rates values to 1 decimal place.) Control Procedure 2 Results Number of deviations Sample size Sample deviation rate Computed upper deviation rate using Tables 1-Sided upper limit using IDEA Auditor's conclusion Use the sample sizes and the number of deviations determined below. Control Procedure 5 % 10 % Parameters Risk of incorrect acceptance Tolerable deviation rate Expected population deviation rate Sample size (using tables) Sample size (using IDEA) % % % 5 5 2 181 181 10 % 7 % 3% 94 % 1 156 156 98 Determine the sample deviation rate, the computed upper deviation rate, and the auditor's conclusion (i.e., testing results do or do not support operating effectiveness of the control) for each control procedure. (For Results, use Table 8-8 & Table 8-9 or IDEA) (Round your rates values to 1 decimal place.) Control Procedure 2 Results Number of deviations Sample size Sample deviation rate Computed upper deviation rate using Tables 1-Sided upper limit using IDEA Auditor's conclusion
Step by Step Solution
There are 3 Steps involved in it

Get step-by-step solutions from verified subject matter experts