

Question: Use the shared results from the Student Data Table and follow the instructions below. 1 Devise a null and alternative hypothesis, then perform a t-test
Use the shared results from the Student Data Table and follow the instructions below.
1 Devise a null and alternative hypothesis, then perform a t-test using alpha=0.05 if our class is taller or shorter than the average human in the United States. Graphically display your answer and statistically write up results. In addition, determine the effect size of this relationship and interpret.
Notes:
1 The average height of adults in the United States is 67.03.8 inches. (Note: this is a population SD)
2 Calculate and interpret the effect size (use Cohen's d):
Cohen's d = (Msample - population) ? ?)
2 Devise a null and alternative hypothesis, then perform a t-test using alpha =0.05 if the students in our class that are born in warm weather months are taller or shorter than those born in cold weather months. Graphically display your answer and statistically write up results. In addition, determine the effect size of this relationship and interpret.
Notes:
1 Population SDs are unknown.
2 Assume the northern hemisphere:
Warm months = April, May, June, July, August, September
Cold months = October, November, December, January, February, March
3 Use Cohen's d effect size:
Cohen's d = (M2 - M1) ? SDpooled) where SDpooled = ?((SD12 + SD22) ? 2)
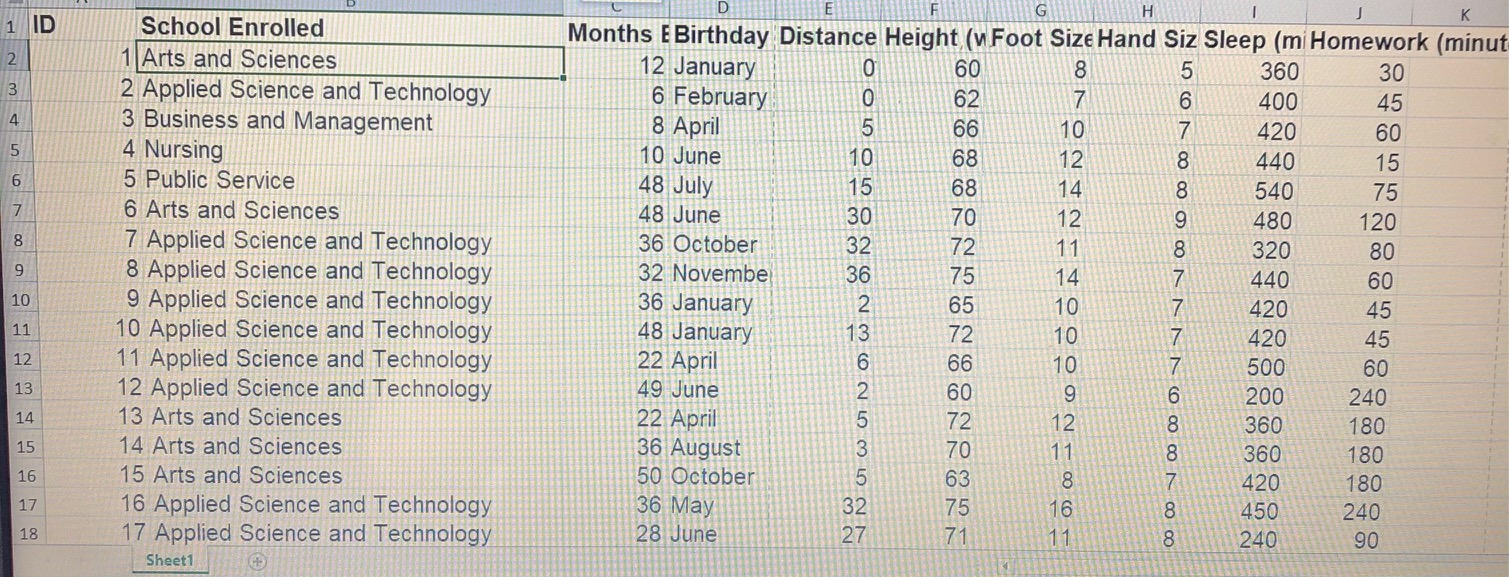
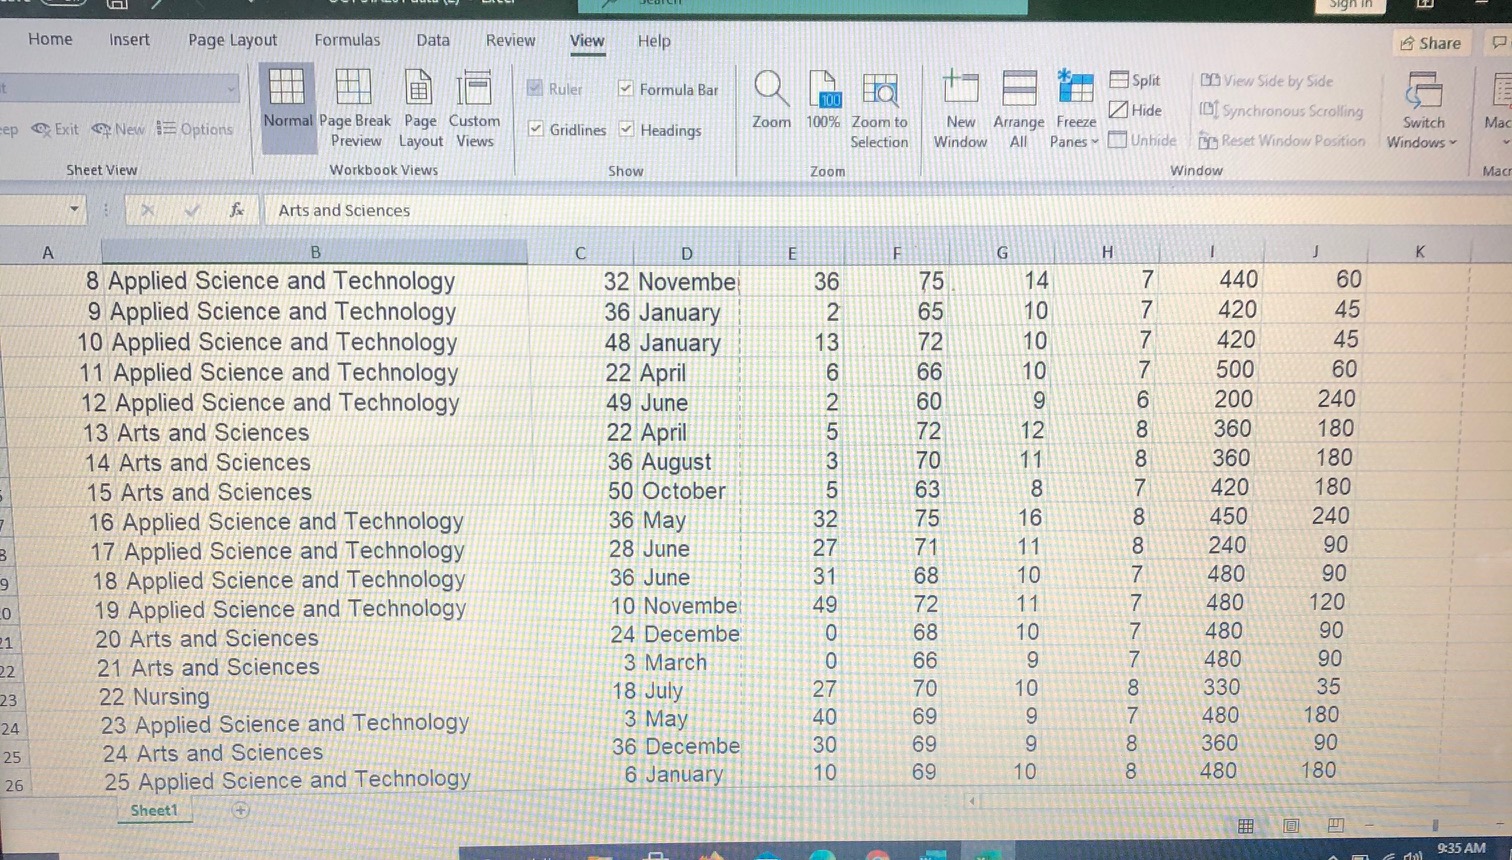
D F G H K 1 ID School Enrolled Months E Birthday Distance Height (v Foot Size Hand Siz Sleep (mi Homework (minut N 1 Arts and Sciences 12 January 60 8 5 360 30 LU 2 Applied Science and Technology 6 February 62 6 400 45 4 3 Business and Management 8 April 66 10 7 420 60 5 4 Nursing 10 June 10 68 12 8 440 15 6 5 Public Service 48 July 15 68 14 540 75 6 Arts and Sciences 48 June 30 70 12 480 120 8 7 Applied Science and Technology 36 October 32 72 11 320 80 9 8 Applied Science and Technology 32 Novembe 36 75 440 60 10 9 Applied Science and Technology 36 January 2 65 420 45 11 10 Applied Science and Technology 48 January 15 72 420 45 NOOOOD 12 11 Applied Science and Technology 22 April 6 66 500 60 13 12 Applied Science and Technology 49 June 200 240 14 13 Arts and Sciences 22 April 360 180 15 14 Arts and Sciences 36 August 360 180 16 15 Arts and Sciences 50 October 420 180 17 16 Applied Science and Technology 36 May 75 450 240 18 17 Applied Science and Technology 28 June 27 71 240 90 Sheet1Sign in Home Insert Page Layout Formulas Data Review View Help Share Ruler Formula Bar O HO Split CO View Side by Side 100 Hide Normal Page Break Page Custom Zoom 100% Zoom to New Arrange Freeze [Of Synchronous Scrolling ep Exit New Options Ma Preview Layout Views Gridlines |Headings Switch Selection Window All Panes Unhide Em Reset Window Position Windows Sheet View Workbook Views Show Zoom Window Mac Arts and Sciences A B C D E G H K 8 Applied Science and Technology 32 Novembe 36 75 14 440 60 9 Applied Science and Technology 36 January 2 65 10 420 45 10 Applied Science and Technology 48 January 13 72 10 420 45 11 Applied Science and Technology 22 April 6 66 10 500 60 12 Applied Science and Technology 49 June 60 9 200 240 13 Arts and Sciences 22 April 360 180 14 Arts and Sciences 36 August 360 180 15 Arts and Sciences 50 October 420 180 16 Applied Science and Technology 36 May 32 450 240 17 Applied Science and Technology 28 June 27 240 90 18 Applied Science and Technology 36 June 31 480 90 19 Applied Science and Technology 10 November 49 480 120 20 Arts and Sciences 24 December 10 480 90 21 Arts and Sciences 3 March 0 480 90 22 Nursing 18 July 70 330 35 23 Applied Science and Technology 69 480 180 24 3 May 40 24 Arts and Sciences 36 Decembe 30 69 360 90 25 25 Applied Science and Technology 6 January 10 69 480 180 26 Sheet1 9:35 AM
Step by Step Solution
There are 3 Steps involved in it

Get step-by-step solutions from verified subject matter experts