

Question: Use the shared results from the Student Data Table and follow the instructions below.Devise a null and alternative hypothesis, then perform a one sample z-test

Use the shared results from the Student Data Table and follow the instructions below.Devise a null and alternative hypothesis, then perform a one sample z-test using alpha=0.05 if our class is taller or shorter than the average human in the United States. Graphically display your answer and statistically write up results. In addition, determine the effect size of this relationship and interpret. Notes:The average height of adults in the United States is 67.03.8 inches. (Note: this is a population SD)Calculate and interpret the effect size (use Cohen's d): Cohen's d = (Msample - population) ? ?)Devise a null and alternative hypothesis, then perform a t-test using alpha =0.05 if the students in our class that are born in warm weather months are taller or shorter than those born in cold weather months. Graphically display your answer and statistically write up results. In addition, determine the effect size of this relationship and interpret.Notes:Population SDs are unknown.Assume the northern hemisphere: Warm months = April, May, June, July, August, September Cold months = October, November, December, January, February, MarchUse Cohen's d effect size: Cohen's d = (M2 - M1) ? SDpooled) where SDpooled = ?((SD12 + SD22) ? 2)
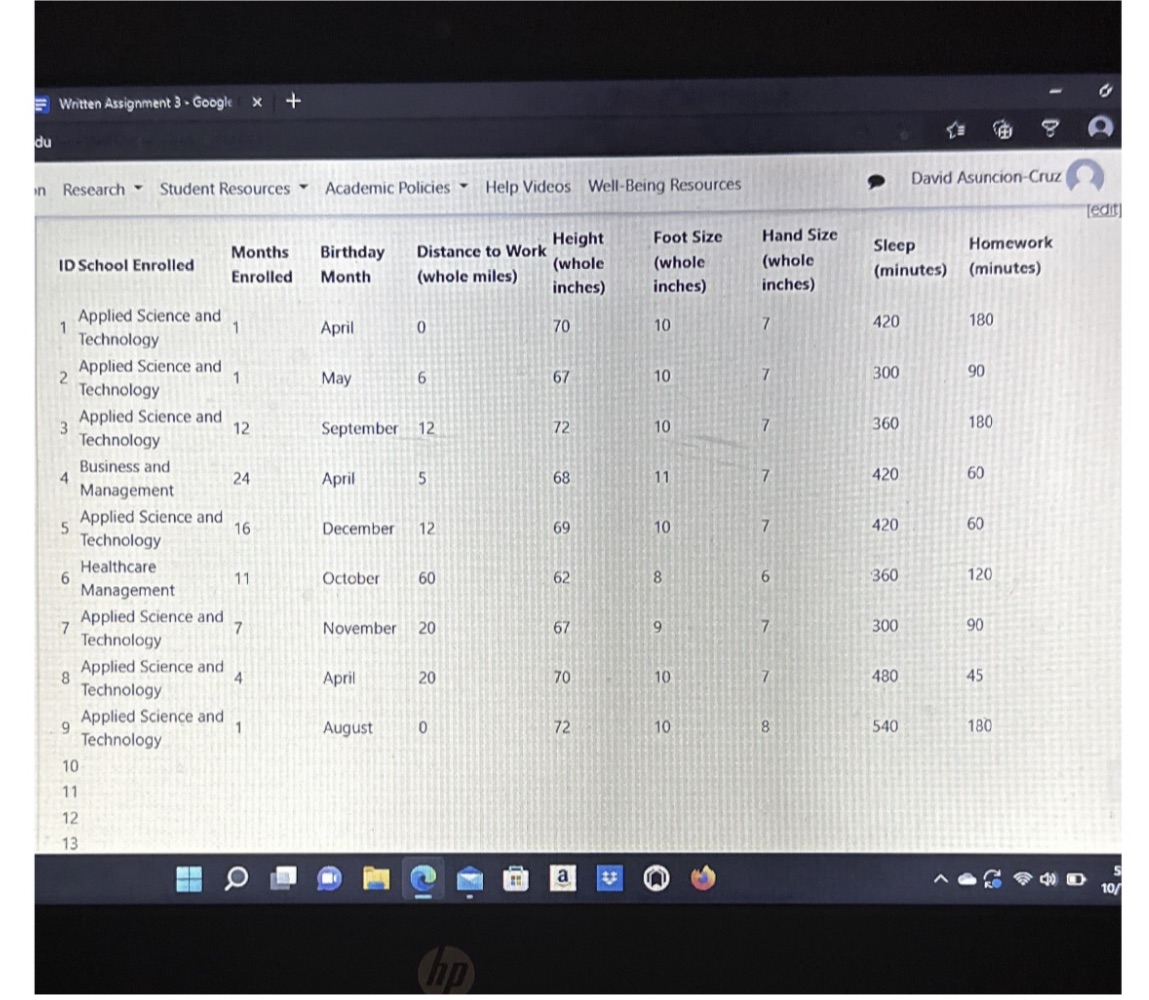
Written Assignment 3 . Google X David Asuncion-Cruz n Research * Student Resources . Academic Policies . Help Videos Well-Being Resources Tedit Height Foot Size Hand Size Sleep Homework Months Birthday Distance to Work ID School Enrolled (whole (whole (whole (whole miles) (minutes) (minutes) Enrolled Month inches) inches) inches) Applied Science and 70 10 420 180 April Technology Applied Science and 67 10 300 90 May Technology Applied Science and 180 12 September 12 72 10 360 Technology Business and 24 April 68 11 420 60 un Management Applied Science and 16 December 12 69 10 420 60 Technology Healthcare 11 October 60 62 360 120 Management Applied Science and November 20 67 300 90 Technology Applied Science and 3 April 20 70 10 480 45 Technology Applied Science and August 0 72 10 8 540 180 Technology 11 12 10/
Step by Step Solution
There are 3 Steps involved in it

Get step-by-step solutions from verified subject matter experts