

Question: Use the spreadsheet information below based off of two stocks, Tesla and Square, to answer the questions shown below. The information you need to answer
Use the spreadsheet information below based off of two stocks, Tesla and Square, to answer the questions shown below. The information you need to answer question 7 and 8 are shown below after the questions. The most important thing I need help with computing the daily returns of this portfolio. Also, I need help determining what the best portfolio would be. I think maybe it is 26% Tesla and 74% Square, but I could be wrong. 
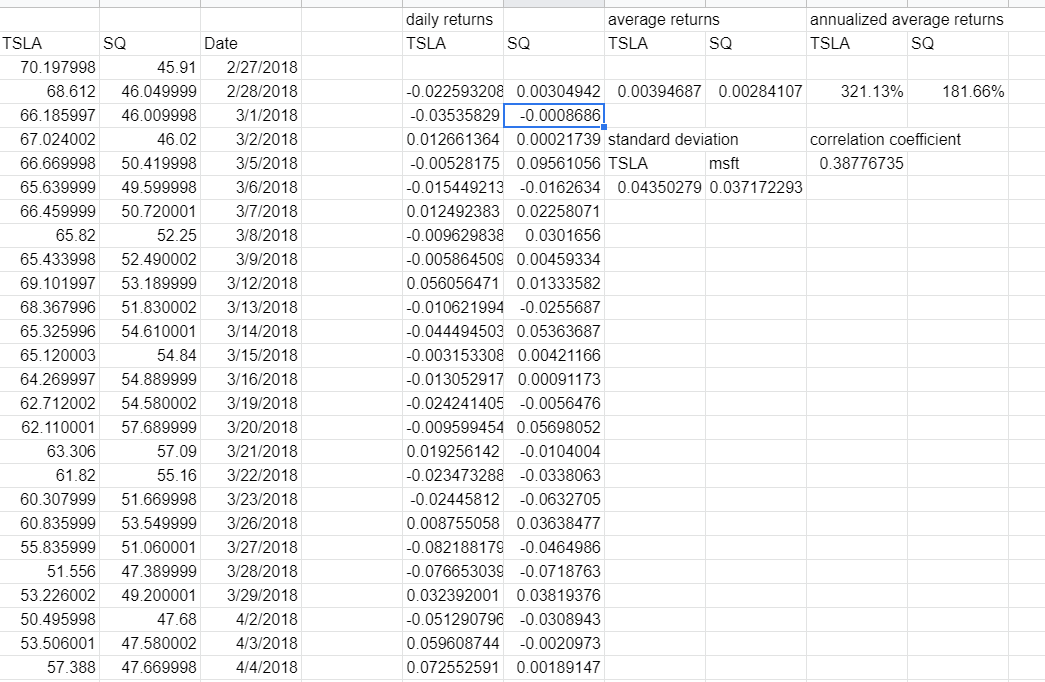
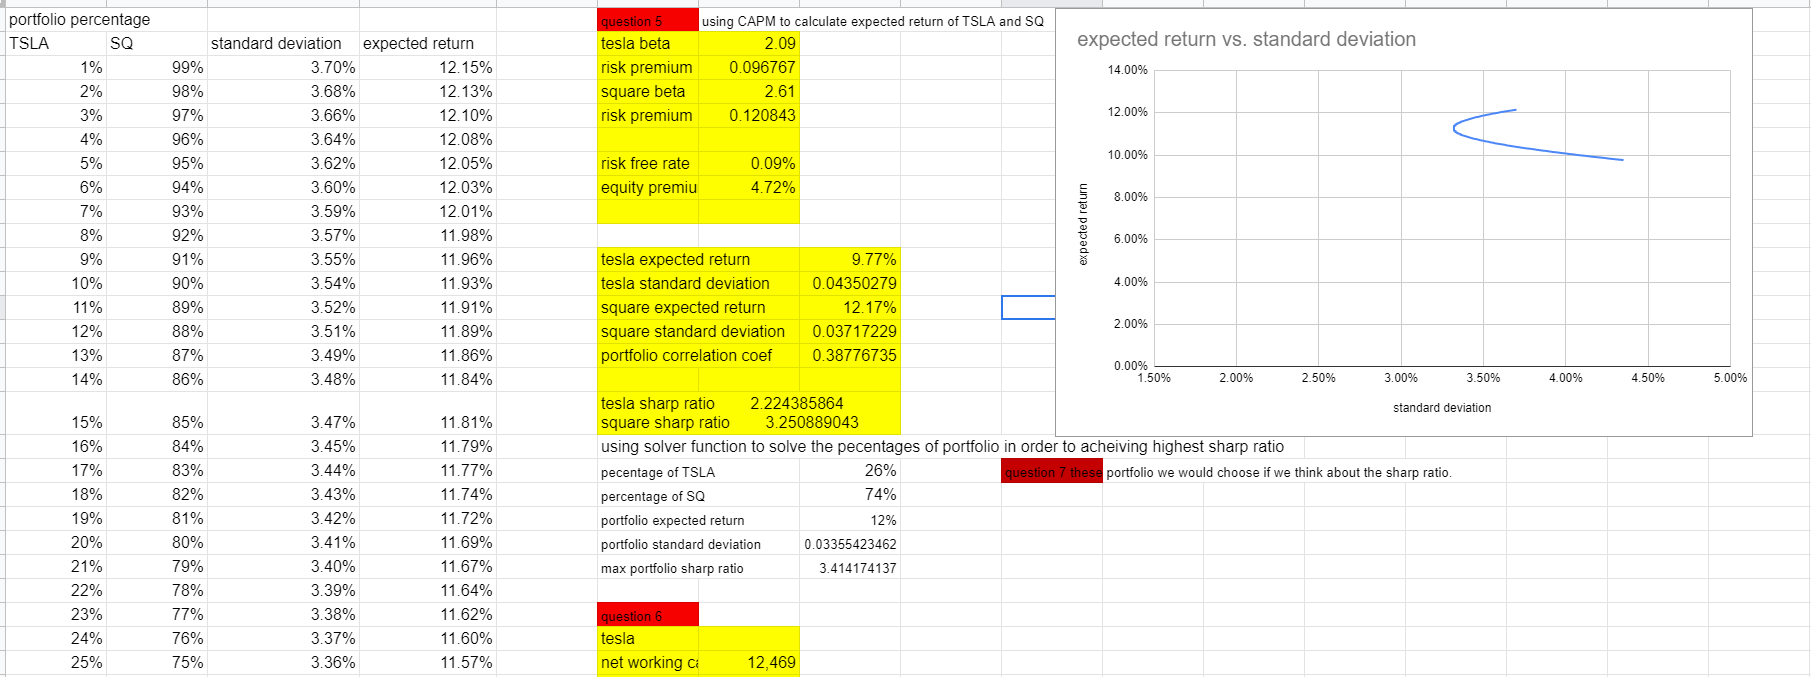
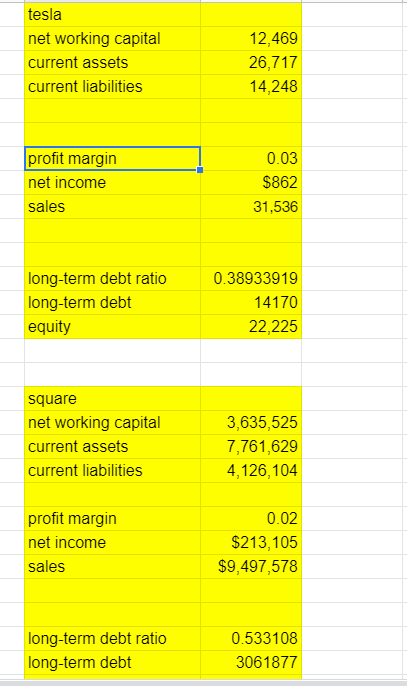
7. Which portfolio would you choose and why (there's no right or wrong answer here, just argue which one you like best in words)? 8. For your favorite portfolio combination, compute daily returns of this portfolio and compare them to the daily returns of each of the individual stocks you have chosen (we leave it fully up to you how you want to "compare"). daily returns TSLA average returns TSLA SQ annualized average returns TSLA SQ SQ 321.13% 181.66% correlation coefficient 0.38776735 TSLA SQ Date 70.197998 45.91 2/27/2018 68.612 46.049999 2/28/2018 66.185997 46.009998 3/1/2018 67.024002 46.02 3/2/2018 66.669998 50.419998 3/5/2018 65.639999 49.599998 3/6/2018 66.459999 50.720001 3/7/2018 65.82 52.25 3/8/2018 65.433998 52.490002 3/9/2018 69.101997 53.189999 3/12/2018 68.367996 51.830002 3/13/2018 65.325996 54.610001 3/14/2018 65.120003 54.84 3/15/2018 64.269997 54.889999 3/16/2018 62.712002 54.580002 3/19/2018 62.110001 57.689999 3/20/2018 63.306 57.09 3/21/2018 61.82 55.16 3/22/2018 60.307999 51.669998 3/23/2018 60.835999 53.549999 3/26/2018 55.835999 51.060001 3/27/2018 51.556 47.389999 3/28/2018 53.226002 49.200001 3/29/2018 50.495998 47.68 4/2/2018 53.506001 47.580002 4/3/2018 57.388 47.669998 4/4/2018 -0.022593208 0.00304942 0.00394687 0.00284107 -0.03535829 -0.0008686 0.012661364 0.00021739 standard deviation -0.00528175 0.09561056 TSLA msft -0.015449213 -0.0162634 0.04350279 0.037172293 0.012492383 0.02258071 -0.009629838 0.0301656 -0.005864509 0.00459334 0.056056471 0.01333582 -0.010621994 -0.0255687 -0.044494503 0.05363687 -0.003153308 0.00421166 -0.013052917 0.00091173 -0.024241405 -0.0056476 -0.009599454 0.05698052 0.019256142 -0.0104004 -0.023473288 -0.0338063 -0.02445812 -0.0632705 0.008755058 0.03638477 -0.082188179 -0.0464986 -0.076653039 -0.0718763 0.032392001 0.03819376 -0.051290796 -0.0308943 0.059608744 -0.0020973 0.072552591 0.00189147 expected return vs. standard deviation question 5 tesla beta risk premium square beta risk premium using CAPM to calculate expected return of TSLA and SQ 2.09 0.096767 2.61 0.120843 14.00% 12.00% 10.00% risk free rate equity premiu 0.09% 4.72% portfolio percentage TSLA SQ 1% 2% 3% 4% 5% 6% 7% 8% 9% 10% 11% 12% 13% 14% 8.00% standard deviation expected return 99% 3.70% 12.15% 98% 3.68% 12.13% 97% 3.66% 12.10% 96% 3.64% 12.08% 95% 3.62% 12.05% 94% 3.60% 12.03% 93% 3.59% 12.01% 92% 3.57% 11.98% 91% 3.55% 11.96% 90% 3.54% 11.93% 89% 3.52% 11.91% 88% 3.51% 11.89% 87% 3.49% 11.86% 86% 3.48% 11.84% expected return 3.00% 4.00% 4.50% 5.00% 6.00% tesla expected return 9.77% tesla standard deviation 0.04350279 4.00% square expected return 12.17% square standard deviation 0.03717229 2.00% portfolio correlation coef 0.38776735 0.00% 1.50% 2.00% 2.50% 3.50% tesla sharp ratio 2.224385864 standard deviation square sharp ratio 3.250889043 using solver function to solve the pecentages of portfolio in order to acheiving highest sharp ratio pecentage of TSLA 26% question 7 these portfolio we would choose if we think about the sharp ratio. percentage of SQ 74% portfolio expected return 12% portfolio standard deviation 0.03355423462 max portfolio sharp ratio 3.414174137 15% 16% 17% 18% 19% 20% 21% 22% 23% 24% 25% 85% 84% 83% 82% 81% 80% 79% 78% 77% 76% 75% 3.47% 3.45% 3.44% 3.43% 3.42% 3.41% 3.40% 3.39% 3.38% 3.37% 3.36% 11.81% 11.79% 11.77% 11.74% 11.72% 11.69% 11.67% 11.64% 11.62% 11.60% 11.57% question 6 tesla net working a 12,469 tesla net working capital current assets current liabilities 12,469 26,717 14,248 profit margin net income sales 0.03 $862 31,536 long-term debt ratio long-term debt equity 0.38933919 14170 22,225 square net working capital current assets current liabilities 3,635,525 7,761,629 4,126,104 profit margin net income sales 0.02 $213,105 $9,497,578 long-term debt ratio long-term debt 0.533108 3061877 7. Which portfolio would you choose and why (there's no right or wrong answer here, just argue which one you like best in words)? 8. For your favorite portfolio combination, compute daily returns of this portfolio and compare them to the daily returns of each of the individual stocks you have chosen (we leave it fully up to you how you want to "compare"). daily returns TSLA average returns TSLA SQ annualized average returns TSLA SQ SQ 321.13% 181.66% correlation coefficient 0.38776735 TSLA SQ Date 70.197998 45.91 2/27/2018 68.612 46.049999 2/28/2018 66.185997 46.009998 3/1/2018 67.024002 46.02 3/2/2018 66.669998 50.419998 3/5/2018 65.639999 49.599998 3/6/2018 66.459999 50.720001 3/7/2018 65.82 52.25 3/8/2018 65.433998 52.490002 3/9/2018 69.101997 53.189999 3/12/2018 68.367996 51.830002 3/13/2018 65.325996 54.610001 3/14/2018 65.120003 54.84 3/15/2018 64.269997 54.889999 3/16/2018 62.712002 54.580002 3/19/2018 62.110001 57.689999 3/20/2018 63.306 57.09 3/21/2018 61.82 55.16 3/22/2018 60.307999 51.669998 3/23/2018 60.835999 53.549999 3/26/2018 55.835999 51.060001 3/27/2018 51.556 47.389999 3/28/2018 53.226002 49.200001 3/29/2018 50.495998 47.68 4/2/2018 53.506001 47.580002 4/3/2018 57.388 47.669998 4/4/2018 -0.022593208 0.00304942 0.00394687 0.00284107 -0.03535829 -0.0008686 0.012661364 0.00021739 standard deviation -0.00528175 0.09561056 TSLA msft -0.015449213 -0.0162634 0.04350279 0.037172293 0.012492383 0.02258071 -0.009629838 0.0301656 -0.005864509 0.00459334 0.056056471 0.01333582 -0.010621994 -0.0255687 -0.044494503 0.05363687 -0.003153308 0.00421166 -0.013052917 0.00091173 -0.024241405 -0.0056476 -0.009599454 0.05698052 0.019256142 -0.0104004 -0.023473288 -0.0338063 -0.02445812 -0.0632705 0.008755058 0.03638477 -0.082188179 -0.0464986 -0.076653039 -0.0718763 0.032392001 0.03819376 -0.051290796 -0.0308943 0.059608744 -0.0020973 0.072552591 0.00189147 expected return vs. standard deviation question 5 tesla beta risk premium square beta risk premium using CAPM to calculate expected return of TSLA and SQ 2.09 0.096767 2.61 0.120843 14.00% 12.00% 10.00% risk free rate equity premiu 0.09% 4.72% portfolio percentage TSLA SQ 1% 2% 3% 4% 5% 6% 7% 8% 9% 10% 11% 12% 13% 14% 8.00% standard deviation expected return 99% 3.70% 12.15% 98% 3.68% 12.13% 97% 3.66% 12.10% 96% 3.64% 12.08% 95% 3.62% 12.05% 94% 3.60% 12.03% 93% 3.59% 12.01% 92% 3.57% 11.98% 91% 3.55% 11.96% 90% 3.54% 11.93% 89% 3.52% 11.91% 88% 3.51% 11.89% 87% 3.49% 11.86% 86% 3.48% 11.84% expected return 3.00% 4.00% 4.50% 5.00% 6.00% tesla expected return 9.77% tesla standard deviation 0.04350279 4.00% square expected return 12.17% square standard deviation 0.03717229 2.00% portfolio correlation coef 0.38776735 0.00% 1.50% 2.00% 2.50% 3.50% tesla sharp ratio 2.224385864 standard deviation square sharp ratio 3.250889043 using solver function to solve the pecentages of portfolio in order to acheiving highest sharp ratio pecentage of TSLA 26% question 7 these portfolio we would choose if we think about the sharp ratio. percentage of SQ 74% portfolio expected return 12% portfolio standard deviation 0.03355423462 max portfolio sharp ratio 3.414174137 15% 16% 17% 18% 19% 20% 21% 22% 23% 24% 25% 85% 84% 83% 82% 81% 80% 79% 78% 77% 76% 75% 3.47% 3.45% 3.44% 3.43% 3.42% 3.41% 3.40% 3.39% 3.38% 3.37% 3.36% 11.81% 11.79% 11.77% 11.74% 11.72% 11.69% 11.67% 11.64% 11.62% 11.60% 11.57% question 6 tesla net working a 12,469 tesla net working capital current assets current liabilities 12,469 26,717 14,248 profit margin net income sales 0.03 $862 31,536 long-term debt ratio long-term debt equity 0.38933919 14170 22,225 square net working capital current assets current liabilities 3,635,525 7,761,629 4,126,104 profit margin net income sales 0.02 $213,105 $9,497,578 long-term debt ratio long-term debt 0.533108 3061877
Step by Step Solution
There are 3 Steps involved in it

Get step-by-step solutions from verified subject matter experts