

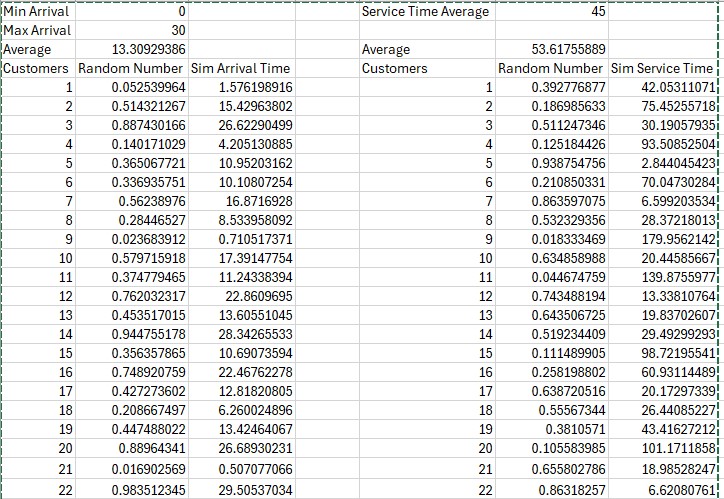
Question: Use the spreadsheet you built before, but add a column after the interarrival random times to calculate the arrival time ( previous arrival time +
Use the spreadsheet you built before, but add a column after the interarrival random times to
calculate the arrival time previous arrival time current interarrival time Use the Service
random values as the service times for each customer. Determine the StartofService time greater
of the previous customers endofservice time and the current customers arrival time and End
ofService time StartofService time Service Time for each customer.
For output, calculate the Wait Times in minutes for each customer StartofService minus
Arrival and the average wait time for the customers. Also find the maximum wait, and the
number of customers waiting less than minute, between and minutes, and greater than
minutes use the COUNTIF function Create a data table that does replications of the
simulation for all those outputs. Average the replications. Determine a confidence interval
for the average wait time. Do all of this before considering the WhatIf scenarios below. You
should end up with a spreadsheet that looks very much like the lecture note and example
spreadsheets.
Now, create a copy of the simulation spreadsheet and copy the random numbers provided in
Canvas Assignment Random Numbers in place of the RAND functions both columns
That way, you all have the same output, but it makes the Data Table and Confidence Interval tabs
irrelevant. For the WhatIf Scenarios make copies of the Simulation tab using the fixed values
for the random numbers, and change the parameters one at a time. Do not combine the scenarios
each one is entirely separate from the others.
WhatIf Scenarios
Raising your prices would decrease the number of customers you have. Change the
maximum arrival time from to and delete the last customers change the
number of customers from to
Options for reducing the service time are:
o Decrease options reduce mean service time from seconds to seconds
Step by Step Solution
There are 3 Steps involved in it
1 Expert Approved Answer
Step: 1 Unlock

Question Has Been Solved by an Expert!
Get step-by-step solutions from verified subject matter experts
Step: 2 Unlock
Step: 3 Unlock