

Use the standard normal table to find the z-score that corresponds to the cumulative area 0.6985....
Fantastic news! We've Found the answer you've been seeking!
Question:

Transcribed Image Text:
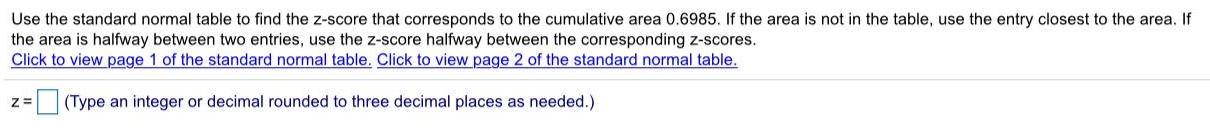
Use the standard normal table to find the z-score that corresponds to the cumulative area 0.6985. If the area is not in the table, use the entry closest to the area. If the area is halfway between two entries, use the z-score halfway between the corresponding z-scores. Click to view page 1 of the standard normal table. Click to view page 2 of the standard normal table. (Type an integer or decimal rounded to three decimal places as needed.) Standard Normal Distribution Critical Values Level of Confidence c 0.80 1.28 Area 0.90 1.645 1.96 2575 0.95 0.99 .00 .01 .02 .03 .04 .05 .06 07 .08 .09 0.0 5000 5040 5080 5120 5160 5199 5239 5279 5319 .5359 0.1 .5398 5438 5478 5517 5557 5596 5636 5675 5714 5753 0.2 5793 5832 5871 5910 5948 5987 .6026 6064 6103 6141 0.3 6179 6217 6255 .6293 6331 6368 SA06 6443 6480 6517 0.4 .6554 6591 6628 .6664 6700 6736 .6772 6808 6844 .6879 6915 7257 7088 7190 7517 0.5 6950 .6985 7019 7054 7123 7157 7224 0.6 7291 7324 7357 7389 7422 7454 7486 7549 0.7 .7580 7611 7642 7673 .7704 7734 7764 7794 7823 7852 0.8 7881 .7910 7939 7967 7995 8023 8051 8078 8106 8133 0.9 8159 8186 8212 8238 8264 8289 8315 8340 8577 8365 8389 1.0 8413 8438 8461 .8485 8508 8531 8554 8599 8621 1.1 .8643 8665 8686 8708 8729 8749 8770 8790 8810 8997 8830 1.2 .8849 8869 8888 8907 8925 8944 8962 8980 9015 1.3 9032 9049 9066 9082 9099 9115 9131 .9147 9162 9177 1.4 9192 9207 9222 9236 .9251 9265 9279 .9292 9306 9429 9319 1.5 9332 9345 9357 9474 9370 9382 9394 9406 .9418 9441 1.6 9452 9463 9484 9495 9505 9515 9525 9535 9545 1.7 9554 9564 9573 9582 9591 9599 9678 9608 9616 9625 9699 9633 9641 9713 9649 9656 9664 9732 1.8 9671 9686 9693 9706 1.9 9719 .9726 9738 9744 9750 9756 9761 9767 2.0 9772 .9778 9826 9783 9788 9793 9798 9842 .9803 9808 9812 9817 9821 9830 9834 9871 2.1 9838 .9846 9850 9854 9857 2,2 9861 9864 9868 9875 9878 9881 9884 9887 9890 2.3 9893 9896 9898 9901 9904 9906 9909 9911 9913 9916 2.4 9918 9920 .9922 .9925 9927 9929 .9931 9932 9934 9936 2.5 9938 9940 9941 9943 9945 9946 9948 9949 9951 9952 2.6 .9953 9955 9956 .9957 9959 9960 .9961 9971 9962 9963 .9964 2.7 9965 9966 9967 9968 9969 9970 9972 9973 .9974 2.8 9974 9975 9976 9977 9977 .9978 9979 9979 9980 9981 9983 .9988 9991 2.9 9981 9982 9987 9982 9984 9984 9989 .9985 9985 9986 9986 9988 9992 .9989 9992 3.0 .9987 9987 9989 9990 .9990 3.1 9990 9991 9991 9992 9992 9993 9993 3.2 .9993 9993 9995 9994 .9994 9994 9994 .9994 9995 9995 9995 9996 9997 9996 9997 3.3 .9995 9995 9996 9996 9996 9996 9997 3.4 .9997 9997 9997 9997 9997 9997 9997 9998 .00 .01 02 .03 .04 Os .06 .07 08 .09 Print Done Use the standard normal table to find the z-score that corresponds to the cumulative area 0.6985. If the area is not in the table, use the entry closest to the area. If the area is halfway between two entries, use the z-score halfway between the corresponding z-scores. Click to view page 1 of the standard normal table. Click to view page 2 of the standard normal table. (Type an integer or decimal rounded to three decimal places as needed.) Standard Normal Distribution Critical Values Level of Confidence c 0.80 1.28 Area 0.90 1.645 1.96 2575 0.95 0.99 .00 .01 .02 .03 .04 .05 .06 07 .08 .09 0.0 5000 5040 5080 5120 5160 5199 5239 5279 5319 .5359 0.1 .5398 5438 5478 5517 5557 5596 5636 5675 5714 5753 0.2 5793 5832 5871 5910 5948 5987 .6026 6064 6103 6141 0.3 6179 6217 6255 .6293 6331 6368 SA06 6443 6480 6517 0.4 .6554 6591 6628 .6664 6700 6736 .6772 6808 6844 .6879 6915 7257 7088 7190 7517 0.5 6950 .6985 7019 7054 7123 7157 7224 0.6 7291 7324 7357 7389 7422 7454 7486 7549 0.7 .7580 7611 7642 7673 .7704 7734 7764 7794 7823 7852 0.8 7881 .7910 7939 7967 7995 8023 8051 8078 8106 8133 0.9 8159 8186 8212 8238 8264 8289 8315 8340 8577 8365 8389 1.0 8413 8438 8461 .8485 8508 8531 8554 8599 8621 1.1 .8643 8665 8686 8708 8729 8749 8770 8790 8810 8997 8830 1.2 .8849 8869 8888 8907 8925 8944 8962 8980 9015 1.3 9032 9049 9066 9082 9099 9115 9131 .9147 9162 9177 1.4 9192 9207 9222 9236 .9251 9265 9279 .9292 9306 9429 9319 1.5 9332 9345 9357 9474 9370 9382 9394 9406 .9418 9441 1.6 9452 9463 9484 9495 9505 9515 9525 9535 9545 1.7 9554 9564 9573 9582 9591 9599 9678 9608 9616 9625 9699 9633 9641 9713 9649 9656 9664 9732 1.8 9671 9686 9693 9706 1.9 9719 .9726 9738 9744 9750 9756 9761 9767 2.0 9772 .9778 9826 9783 9788 9793 9798 9842 .9803 9808 9812 9817 9821 9830 9834 9871 2.1 9838 .9846 9850 9854 9857 2,2 9861 9864 9868 9875 9878 9881 9884 9887 9890 2.3 9893 9896 9898 9901 9904 9906 9909 9911 9913 9916 2.4 9918 9920 .9922 .9925 9927 9929 .9931 9932 9934 9936 2.5 9938 9940 9941 9943 9945 9946 9948 9949 9951 9952 2.6 .9953 9955 9956 .9957 9959 9960 .9961 9971 9962 9963 .9964 2.7 9965 9966 9967 9968 9969 9970 9972 9973 .9974 2.8 9974 9975 9976 9977 9977 .9978 9979 9979 9980 9981 9983 .9988 9991 2.9 9981 9982 9987 9982 9984 9984 9989 .9985 9985 9986 9986 9988 9992 .9989 9992 3.0 .9987 9987 9989 9990 .9990 3.1 9990 9991 9991 9992 9992 9993 9993 3.2 .9993 9993 9995 9994 .9994 9994 9994 .9994 9995 9995 9995 9996 9997 9996 9997 3.3 .9995 9995 9996 9996 9996 9996 9997 3.4 .9997 9997 9997 9997 9997 9997 9997 9998 .00 .01 02 .03 .04 Os .06 .07 08 .09 Print Done
Expert Answer:

Related Book For 

Elementary Statistics Picturing the World
ISBN: 978-0134683416
7th edition
Authors: Ron Larson, Betsy Farber
Posted Date:
Students also viewed these mathematics questions
-
Use the standard Normal table to find the following cut-off values for Z. Also sketch a standard Normal curve, and shade the region corresponding to the given probability. a. P (Z z) = 0.15 c. P (-z...
-
Use the standard Normal table to find the following cut-off values for Z. Also sketch a standard Normal curve, and shade the region corresponding to the given probability. a. P (Z < z) = 0.5 b. P (Z...
-
Use the standard normal table to determine that probability that a. z is between 0 and 1.2; that is, find P(0 z 1.2). b. z is greater than or equal to 1.85; that is, find P(z 1.85). c. z is...
-
Mookie The Beagle Concierge Trial Balance As of January 31,2023 is given 1001 Checking 1010 Money Market 1100 Accounts Receivable (A/R) 1210 Prepaid Expenses:Supplies 1220 Prepaid Expenses:Insurance...
-
Create a sample of five numbers whose mean is 6 and whose standard deviation is 0.
-
A student sits on a freely rotating stool holding two weights, each of mass 3.00 kg (Figure P11.30). When his arms are extended horizontally, the weights are 1.00 m from the axis of rotation and he...
-
The following TI-84 Plus display presents the results of a test of the null hypothesis H0: 1 = 0. a. What is the alternate hypothesis? b. What is the value of the test statistic? c. How many degrees...
-
Just for Feet operated in an extremely competitive industry, or sub industry. Identify inherent risk factors common to businesses facing such competitive conditions. How should these risks affect the...
-
Crane Bottling Corporation is considering the purchase of a new bottling machine. The machine would cost $184,800 and has an estimated useful life of 8 years with zero salvage value. Management...
-
Refer back to the beginning of this chapter to the excerpt from a Los Angeles Times article about Reed Slatkin's fraud. The article insinuates that the FBI and IRS's raiding of Slatkin's office...
-
You can choose to do either one of the following two subproblems. (1) For the circuit system below, derive the state space model. Note that the input u is a current, the output y is a voltage, and...
-
Find an example of a large project that took more than a year to complete. Describe some of the planning work completed for the project as part of project integration and scope management. Summarize...
-
Review the characteristics of leadership described by Follett. Have you ever worked for a person with those qualities? Discuss why those qualities contribute to effective leadership.
-
Describe the relationship between the mean and the median of this distribution. 8 7 6 5 4 3 2 1 0 3 4 5 6 7
-
What are concurrent tests and why are they sometimes used?
-
Describe the relationship between the mode and the median of this distribution. 8 7 6 65 4 32 10 3 4 5 6 7
-
A boy is spinning a rock around in a horizontal circle over his head. The rock is tied to a string. The child is unsuccessfully trying to kill pigeons with his rock by letting it go and watching it...
-
The National Collegiate Athletic Association (NCAA) and the National Federation of State High School Associations (NFHS) set a new standard for non-wood baseball bats. Their goal was to ensure that...
-
Random samples of size 8 are drawn from the population and the mean of each sample is determined. Is the sampling distribution of sample means normally distributed? Explain. The per capita disposable...
-
Test the claim about the population mean at the level of significance a. Assume the population is normally distributed. Claim: > 12,700; = 0.005. Sample statistics: x = 12,855, = 248, n = 21
-
Use the Standard Normal Table or technology to find the z-score that corresponds to the cumulative area or percentile. P 91
-
Cindy Belton opened a law office, Cindy Belton, Attorney at Law, on July 1, 2008. On July 31, the balance sheet showed Cash \($4,000,\) Accounts Receivable \($1,500,\) Supplies \($500,\) Office...
-
The actual financial statements of PepsiCo, as presented in the companys 2005 Annual Report, are contained in Appendix A (at the back of the textbook). Instructions Refer to PepsiCos financial...
-
PepsiCos financial statements are presented in Appendix A. The Coca-Cola Companys financial statements are presented in Appendix B. Instructions (a) Based on the information contained in these...

Study smarter with the SolutionInn App