

Use the standard normal table to find the z-score that corresponds to the given percentile. If...
Fantastic news! We've Found the answer you've been seeking!
Question:
Transcribed Image Text:
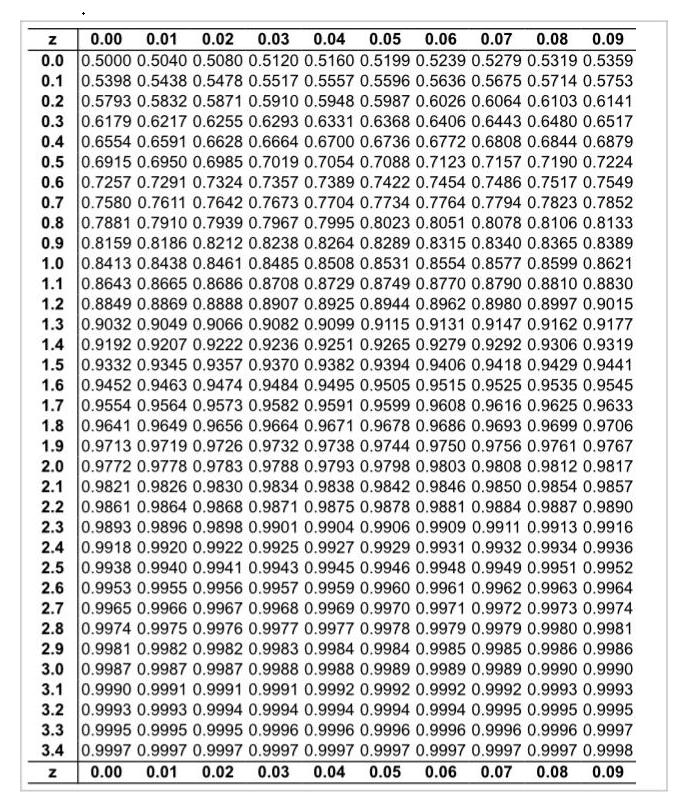
Use the standard normal table to find the z-score that corresponds to the given percentile. If the area is not in the table, use the entry closest to the area. If the area is halfway between two entries, use the z-score halfway between the corresponding z-scores. If convenient, use technology to find the z-score. P2 Click to view page 1 of the table. Click to view page 2 of the table. The z-score that corresponds to P2 is (Round to two decimal places as needed.) 0.00 0.01 0.02 0.03 0.04 0.05 0.06 0.07 0.08 0.09 0.0 0.5000 0.5040 0.5080 0.5120 0.5160 0.5199 0.5239 0.5279 0.5319 0.5359 0.1 0.5398 0.5438 0.5478 0.5517 0.5557 0.5596 0.5636 0.5675 0.5714 0.5753 0.2 0.5793 0.5832 0.5871 0.5910 0.5948 0.5987 0.6026 0.6064 0.6103 0.6141 0.3 0.6179 0.6217 0.6255 0.6293 0.6331 0.6368 0.6406 0.6443 0.6480 0.6517 0.4 0.6554 0.6591 0.6628 0.6664 0.6700 0.6736 0.6772 0.6808 0.6844 0.6879 0.5 0.6915 0.6950 0.6985 0.7019 0.7054 0.7088 0.7123 0.7157 0.7190 0.7224 0.6 0.7257 0.7291 0.7324 0.7357 0.7389 0.7422 0.7454 0.7486 0.7517 0.7549 0.7 0.7580 0.7611 0.7642 0.7673 0.7704 0.7734 0.7764 0.7794 0.7823 0.7852 0.8 0.7881 0.7910 0.7939 0.7967 0.7995 0.8023 0.8051 0.8078 0.8106 0.8133 0.9 0.8159 0.8186 0.8212 0.8238 0.8264 0.8289 0.8315 0.8340 0.8365 0.8389 1.0 0.8413 0.8438 0.8461 0.8485 0.8508 0.8531 0.8554 0.8577 0.8599 0.8621 1.1 0.8643 0.8665 0.8686 0.8708 0.8729 0.8749 0.8770 0.8790 0.8810 0.8830 1.2 0.8849 0.8869 0.8888 0.8907 0.8925 0.8944 0.8962 0.8980 0.8997 0.9015 1.3 0.9032 0.9049 0.9066 0.9082 0.9099 0.9115 0.9131 0.9147 0.9162 0.9177 1.4 0.9192 0.9207 0.9222 0.9236 0.9251 0.9265 0.9279 0.9292 0.9306 0.9319 1.5 0.9332 0.9345 0.9357 0.9370 0.9382 0.9394 0.9406 0.9418 0.9429 0.9441 1.6 0.9452 0.9463 0.9474 0.9484 0.9495 0.9505 0.9515 0.9525 0.9535 0.9545 1.7 0.9554 0.9564 0.9573 0.9582 0.9591 0.9599 0.9608 0.9616 0.9625 0.9633 1.8 0.9641 0.9649 0.9656 0.9664 0.9671 0.9678 0.9686 0.9693 0.9699 0.9706 1.9 0.9713 0.9719 0.9726 0.9732 0.9738 0.9744 0.9750 0.9756 0.9761 0.9767 2.0 0.9772 0.9778 0.9783 0.9788 0.9793 0.9798 0.9803 0.9808 0.9812 0.9817 2.1 0.9821 0.9826 0.9830 0.9834 0.9838 0.9842 0.9846 0.9850 0.9854 0.9857 2.2 0.9861 0.9864 0.9868 0.9871 0.9875 0.9878 0.9881 0.9884 0.9887 0.9890 2.3 0.9893 0.9896 0.9898 0.9901 0.9904 0.9906 0.9909 0.9911 0.9913 0.9916 2.4 0.9918 0.9920 0.9922 0.9925 0.9927 0.9929 0.9931 0.9932 0.9934 0.9936 2.5 0.9938 0.9940 0.9941 0.9943 0.9945 0.9946 0.9948 0.9949 0.9951 0.9952 2.6 0.9953 0.9955 0.9956 0.9957 0.9959 0.9960 0.9961 0.9962 0.9963 0.9964 2.7 0.9965 0.9966 0.9967 0.9968 0.9969 0.9970 0.9971 0.9972 0.9973 0.9974 2.8 0.9974 0.9975 0.9976 0.9977 0.9977 0.9978 0.9979 0.9979 0.9980 0.9981 2.9 0.9981 0.9982 0.9982 0.9983 0.9984 0.9984 0.9985 0.9985 0.9986 0.9986 3.0 0.9987 0.9987 0.9987 0.9988 0.9988 0.9989 0.9989 0.9989 0.9990 0.9990 3.1 0.9990 0.9991 0.9991 0.9991 0.9992 0.9992 0.9992 0.9992 0.9993 0.9993 3.2 0.9993 0.9993 0.9994 0.9994 0.9994 0.9994 0.9994 0.9995 0.9995 0.9995 3.3 0.9995 0.9995 0.9995 0.9996 0.9996 0.9996 0.9996 0.9996 0.9996 0.9997 3.4 0.9997 0.9997 0.9997 0.9997 0.9997 0.9997 0.9997 0.9997 0.9997 0.9998 0.00 0.01 0.02 0.03 0.04 0.05 0.06 0.07 0.08 0.09 Use the standard normal table to find the z-score that corresponds to the given percentile. If the area is not in the table, use the entry closest to the area. If the area is halfway between two entries, use the z-score halfway between the corresponding z-scores. If convenient, use technology to find the z-score. P2 Click to view page 1 of the table. Click to view page 2 of the table. The z-score that corresponds to P2 is (Round to two decimal places as needed.) 0.00 0.01 0.02 0.03 0.04 0.05 0.06 0.07 0.08 0.09 0.0 0.5000 0.5040 0.5080 0.5120 0.5160 0.5199 0.5239 0.5279 0.5319 0.5359 0.1 0.5398 0.5438 0.5478 0.5517 0.5557 0.5596 0.5636 0.5675 0.5714 0.5753 0.2 0.5793 0.5832 0.5871 0.5910 0.5948 0.5987 0.6026 0.6064 0.6103 0.6141 0.3 0.6179 0.6217 0.6255 0.6293 0.6331 0.6368 0.6406 0.6443 0.6480 0.6517 0.4 0.6554 0.6591 0.6628 0.6664 0.6700 0.6736 0.6772 0.6808 0.6844 0.6879 0.5 0.6915 0.6950 0.6985 0.7019 0.7054 0.7088 0.7123 0.7157 0.7190 0.7224 0.6 0.7257 0.7291 0.7324 0.7357 0.7389 0.7422 0.7454 0.7486 0.7517 0.7549 0.7 0.7580 0.7611 0.7642 0.7673 0.7704 0.7734 0.7764 0.7794 0.7823 0.7852 0.8 0.7881 0.7910 0.7939 0.7967 0.7995 0.8023 0.8051 0.8078 0.8106 0.8133 0.9 0.8159 0.8186 0.8212 0.8238 0.8264 0.8289 0.8315 0.8340 0.8365 0.8389 1.0 0.8413 0.8438 0.8461 0.8485 0.8508 0.8531 0.8554 0.8577 0.8599 0.8621 1.1 0.8643 0.8665 0.8686 0.8708 0.8729 0.8749 0.8770 0.8790 0.8810 0.8830 1.2 0.8849 0.8869 0.8888 0.8907 0.8925 0.8944 0.8962 0.8980 0.8997 0.9015 1.3 0.9032 0.9049 0.9066 0.9082 0.9099 0.9115 0.9131 0.9147 0.9162 0.9177 1.4 0.9192 0.9207 0.9222 0.9236 0.9251 0.9265 0.9279 0.9292 0.9306 0.9319 1.5 0.9332 0.9345 0.9357 0.9370 0.9382 0.9394 0.9406 0.9418 0.9429 0.9441 1.6 0.9452 0.9463 0.9474 0.9484 0.9495 0.9505 0.9515 0.9525 0.9535 0.9545 1.7 0.9554 0.9564 0.9573 0.9582 0.9591 0.9599 0.9608 0.9616 0.9625 0.9633 1.8 0.9641 0.9649 0.9656 0.9664 0.9671 0.9678 0.9686 0.9693 0.9699 0.9706 1.9 0.9713 0.9719 0.9726 0.9732 0.9738 0.9744 0.9750 0.9756 0.9761 0.9767 2.0 0.9772 0.9778 0.9783 0.9788 0.9793 0.9798 0.9803 0.9808 0.9812 0.9817 2.1 0.9821 0.9826 0.9830 0.9834 0.9838 0.9842 0.9846 0.9850 0.9854 0.9857 2.2 0.9861 0.9864 0.9868 0.9871 0.9875 0.9878 0.9881 0.9884 0.9887 0.9890 2.3 0.9893 0.9896 0.9898 0.9901 0.9904 0.9906 0.9909 0.9911 0.9913 0.9916 2.4 0.9918 0.9920 0.9922 0.9925 0.9927 0.9929 0.9931 0.9932 0.9934 0.9936 2.5 0.9938 0.9940 0.9941 0.9943 0.9945 0.9946 0.9948 0.9949 0.9951 0.9952 2.6 0.9953 0.9955 0.9956 0.9957 0.9959 0.9960 0.9961 0.9962 0.9963 0.9964 2.7 0.9965 0.9966 0.9967 0.9968 0.9969 0.9970 0.9971 0.9972 0.9973 0.9974 2.8 0.9974 0.9975 0.9976 0.9977 0.9977 0.9978 0.9979 0.9979 0.9980 0.9981 2.9 0.9981 0.9982 0.9982 0.9983 0.9984 0.9984 0.9985 0.9985 0.9986 0.9986 3.0 0.9987 0.9987 0.9987 0.9988 0.9988 0.9989 0.9989 0.9989 0.9990 0.9990 3.1 0.9990 0.9991 0.9991 0.9991 0.9992 0.9992 0.9992 0.9992 0.9993 0.9993 3.2 0.9993 0.9993 0.9994 0.9994 0.9994 0.9994 0.9994 0.9995 0.9995 0.9995 3.3 0.9995 0.9995 0.9995 0.9996 0.9996 0.9996 0.9996 0.9996 0.9996 0.9997 3.4 0.9997 0.9997 0.9997 0.9997 0.9997 0.9997 0.9997 0.9997 0.9997 0.9998 0.00 0.01 0.02 0.03 0.04 0.05 0.06 0.07 0.08 0.09
Expert Answer:

Related Book For 

Elementary Statistics Picturing the World
ISBN: 978-0134683416
7th edition
Authors: Ron Larson, Betsy Farber
Posted Date:
Students also viewed these mathematics questions
-
Use the standard normal table to determine that probability that a. z is between 0 and 1.2; that is, find P(0 z 1.2). b. z is greater than or equal to 1.85; that is, find P(z 1.85). c. z is...
-
Use the standard normal table to determine that probability that a. z is between 0 and 1; that is, find P(0 z 1). b. z is greater than or equal to 1.5; that is, find P(z 1.5). c. z is between 2...
-
Use the standard normal table to determine that probability that a. z is between 0 and 1.48; that is, find P(0 z 1.48). b. z is greater than or equal to 2.67; that is, find P( z 2.67). c. z is...
-
The data in the chart below is for the distance (in cm) to the near point, the point nearest the eye at which the eye can accurately focus, at a persons age. Age (years) Near Point (cm) 10 7.5 20 9...
-
A survey of golfers asked the following questions. Identify the type of data each question produces. a. How many rounds of golf do you play annually? b. Are you a member of a private club? c. What...
-
Arbitrarily define the instantaneous vector height of a person as the displacement vector from the point halfway between his or her feet to the top of the head. Make an order-of-magnitude estimate of...
-
In 1906, the statistician Karl Pearson measured the heights of 1078 pairs of fathers and sons. The following table presents a sample of 16 pairs, with height measured in inches, simulated from the...
-
The Farmyard Gate A gate 4.00 m wide and 2.00 m high weighs 500 N. Its center of gravity is at its center, and it is hinged at A and B. To relieve the strain on the top hinge, a wire CD is connected...
-
Consider a zero-coupon bond with $1,000 face value and 29 to maturity.If the YTM is 4.27%,this bond will trade at a price of?
-
APC, Inc is a venture capital firm that invests in new businesses to help them grow. Wyatt Newark owns and serves as a chef at Earp's, a restaurant with a Western design that he operates as a sole...
-
1. Suppose there is an all-equity firm with 18 million shares that is currently sitting on $106 million in cash. What will be the firm's share price if it uses $69 million of its cash to repurchase...
-
The departments are as follows: Department A: Agricultural Workers Department B: Office Workers The first day of work for Prevosti Farms and Sugarhouse for all employees is February 1, 2022. February...
-
10 Henderson Company uses the gross profit method to estimate ending inventory and cost of goods sold when preparing monthly financial statements required by its bank. Inventory on hand at the end of...
-
Glenn Owens attractive technology start-up requires $10 million to launch. Projections show earnings of $10 million and sales of $80 million in the fifth year. The venture capital firm expects a...
-
The table gives a utility schedule for Anton. Number of Doughnuts Total Utility 12 2 33 43 50 5 56 6 60 What important property does Anton's utility exhibit?
-
Entity X acquired a computer-controlled machine for production purposes together with software. The purchase price of that machine was OMR 17,500 and the cost of software was OMR 2,500 which is...
-
1. The Hong Kong Health Authority obtained the following sample time data for completing a vacci- nation procedure (in minutes): Time (in minutes) Frequency 1- below 4 2 4- below 7 5 7- below 10 9 10...
-
State whether each of the following will increase or decrease the power of a one-way between-subjects ANOVA. (a) The effect size increases. (b) Mean square error decreases. (c) Mean square between...
-
Find the probability of randomly selecting an adult who does not identify as middle class. Use the Pareto chart, which shows the results of a survey in which 3078 adults were asked with which social...
-
A random sample of 100 medical school applicants at a university has a mean total score of 502 on the MCAT. According to a report, the mean total score for the schools applicants is more than 499....
-
When estimating a population mean, are you more likely to be correct when you use a point estimate or an interval estimate? Explain your reasoning.
-
Based on Equation 5.46, what value of \(\beta\) would result in the annual minimum value of the incidence angle \(i\) ? Note that this tilt angle would result in maximum collection of beam radiation...
-
Equation 5.53 is based on an early solar constant value of \(1394 \mathrm{~W} / \mathrm{m}^{2}\). Derive a modified form of Equation 5.53 based on the presently accepted value for the solar constant...
-
(a) Design a PI controller for Problem 8.6-4(b). (b) Design a PD controller for Problem 8.6-4(c). (c) Use the results of parts (a) and (b) to repeat Problem 8.6-4(d). Problem 8.6-4(b) (c) (d) (b)...

Study smarter with the SolutionInn App