

Question: Use the stated CAGR from the graph below as the growth rate (g) for your Constant Growth Model valuation. Assume a 10.5% discount rate (R).
Use the stated CAGR from the graph below as the growth rate (g) for your Constant Growth Model valuation.
Assume a 10.5% discount rate (R).
Calculate an estimated value of a share of the stock using the Constant Growth Model
By using the historical rate of growth in the dividend, the assumption is that the company will sustain its recent rate of dividend growth into the future.
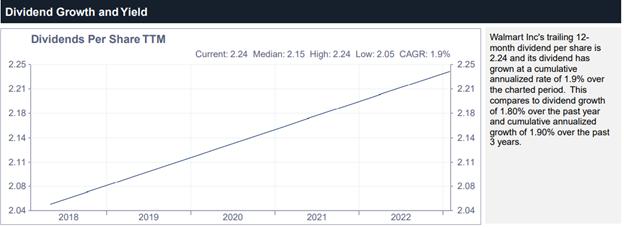
Dividend Growth and Yield 2.25 2.21 2.18- 2.14 2.11 2.08 Dividends Per Share TTM 2.04 2018 2019 Current: 2.24 Median: 2.15 High: 2.24 Low: 2.05 CAGR: 1.9% 2020 2021 2022 2.25 2.21 2.18 2.14 2.11 2.08 2.04 Walmart Inc's trailing 12- month dividend per share is 2.24 and its dividend has grown at a cumulative annualized rate of 1.9% over the charted period. This compares to dividend growth of 1.80% over the past year and cumulative annualized growth of 1.90% over the past 3 years.
Step by Step Solution
3.38 Rating (167 Votes )
There are 3 Steps involved in it
The image youve provided shows a graph with a CAGR Compound Annual Growth Rate of 19 for the dividen... View full answer

Get step-by-step solutions from verified subject matter experts