

Question: Use the supply and demand graph below to answer the next two questions (1 pt. each - for both questions, assume A is the
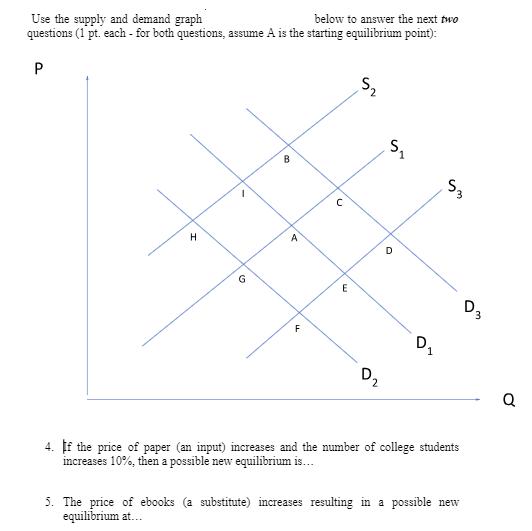
Use the supply and demand graph below to answer the next two questions (1 pt. each - for both questions, assume A is the starting equilibrium point): P H 1 G B A F E S D S D 1 S3 4. If the price of paper (an input) increases and the number of college students increases 10%, then a possible new equilibrium is... 5. The price of ebooks (a substitute) increases resulting in a possible new equilibrium at... D 3 Q
Step by Step Solution
3.45 Rating (158 Votes )
There are 3 Steps involved in it
The supply and demand graph shows the relationship between the quantity of books sold and their pric... View full answer

Get step-by-step solutions from verified subject matter experts