

Question: Use the table below and Apple's financial statements in Appendix A to answer the following. $ millions Interest expense 2017 2016 $2,323 $1,456 2015 $733
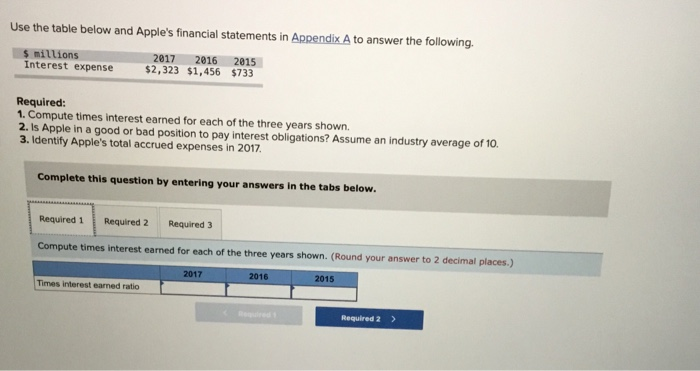
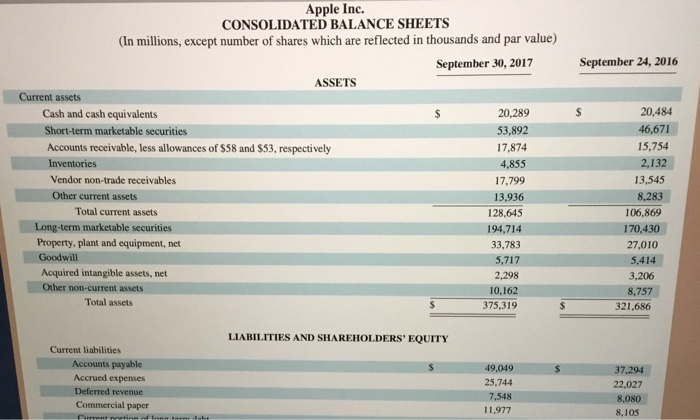
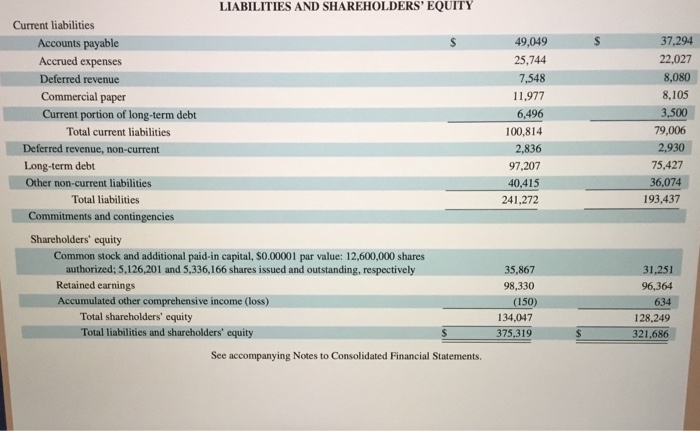
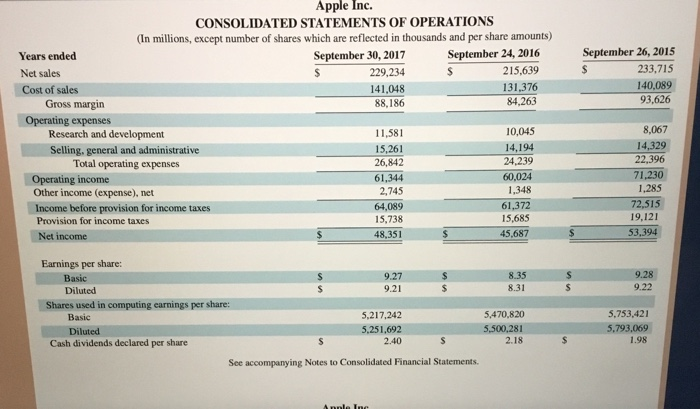
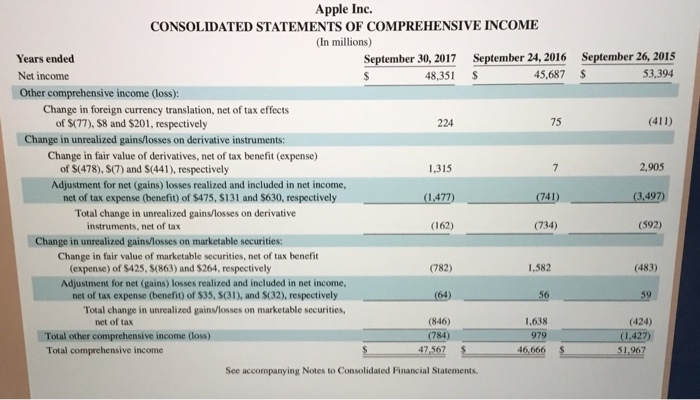
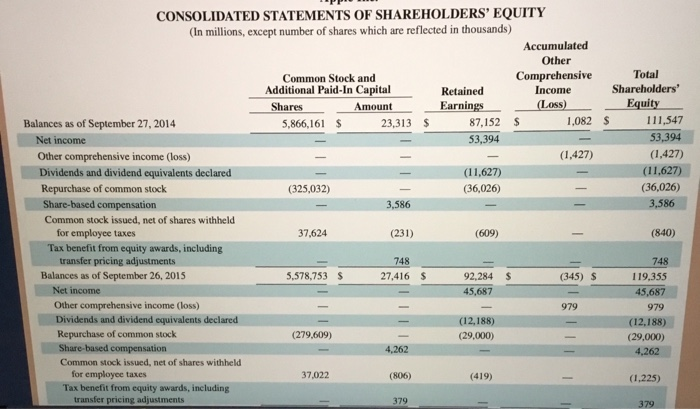
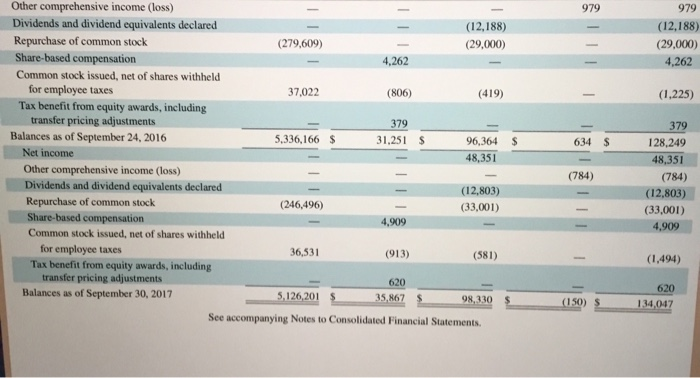
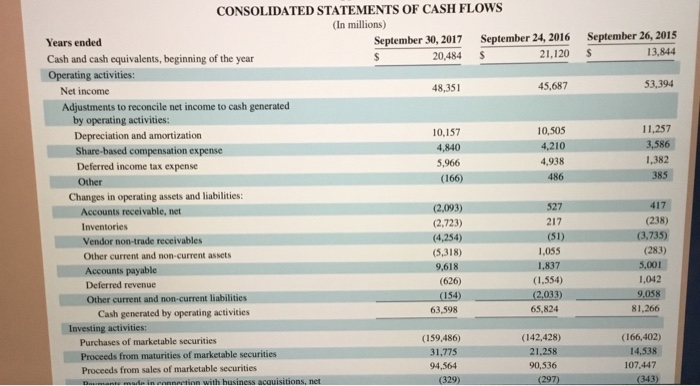
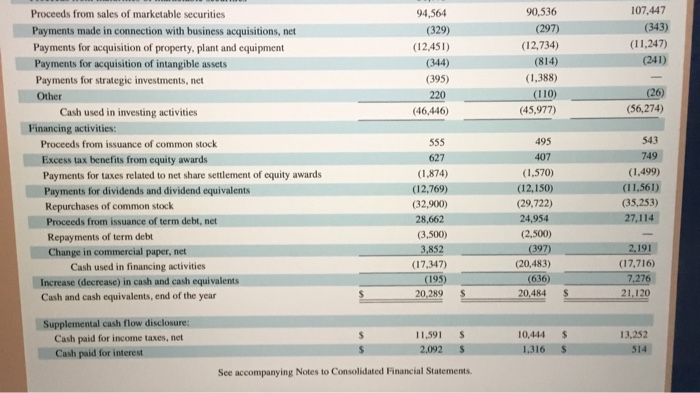
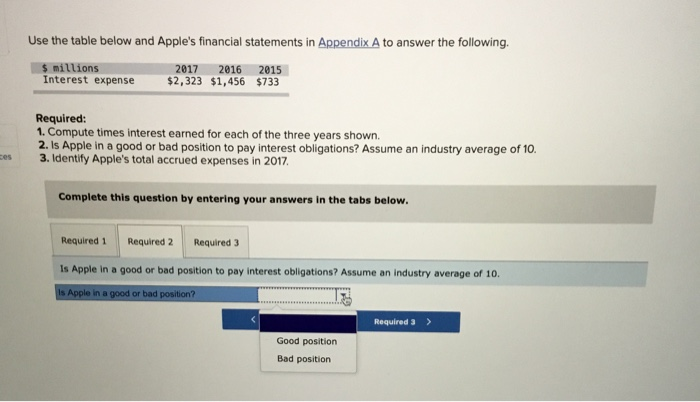
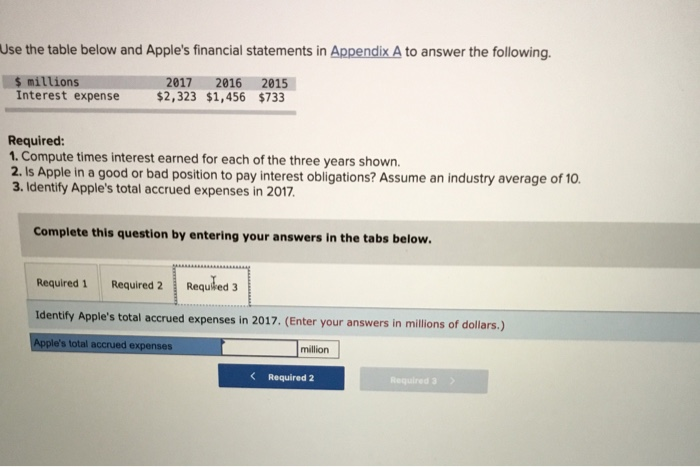
Use the table below and Apple's financial statements in Appendix A to answer the following. $ millions Interest expense 2017 2016 $2,323 $1,456 2015 $733 Required: 1. Compute times interest earned for each of the three years shown. 2. Is Apple in a good or bad position to pay interest obligations? Assume an industry average of 10 3. Identify Apple's total accrued expenses in 2017. Complete this question by entering your answers in the tabs below. Required 1 Required 2 Required 3 Compute times interest earned for each of the three years shown. (Round your answer to 2 decimal places.) 2017 2016 2015 Times interest earned ratio Required 2 > September 24, 2016 $ Apple Inc. CONSOLIDATED BALANCE SHEETS (In millions, except number of shares which are reflected in thousands and par value) September 30, 2017 ASSETS Current assets Cash and cash equivalents 20.289 Short-term marketable securities 53,892 Accounts receivable, less allowances of $58 and $53, respectively 17,874 Inventories 4,855 Vendor non-trade receivables 17.799 Other current assets 13,936 Total current assets 128,645 Long-term marketable securities 194,714 Property, plant and equipment, net 33,783 Goodwill 5,717 Acquired intangible assets, net 2,298 Other non-current assets 10.162 Total assets 375,319 20,484 46,671 15,754 2,132 13,545 8,283 106,869 170,430 27,010 5.414 3,206 8,757 321.686 LIABILITIES AND SHAREHOLDERS' EQUITY Current liabilities Accounts payable Accrued expenses Deferred revenue Commercial paper 49,049 25.744 7,548 11,977 37.294 22,027 8,080 8,105 LIABILITIES AND SHAREHOLDERS' EQUITY 49,049 25,744 7,548 Current liabilities Accounts payable Accrued expenses Deferred revenue Commercial paper Current portion of long-term debt Total current liabilities Deferred revenue, non-current Long-term debt Other non-current liabilities Total liabilities Commitments and contingencies 11,977 6,496 100,814 2,836 97,207 40,415 241,272 37,294 22,027 8,080 8,105 3,500 79,006 2,930 75,427 36,074 193,437 Shareholders' equity Common stock and additional paid-in capital, S0.00001 par value: 12,600,000 shares authorized; 5,126,201 and 5,336,166 shares issued and outstanding, respectively Retained earnings Accumulated other comprehensive income (loss) Total shareholders' equity Total liabilities and shareholders' equity See accompanying Notes to Consolidated Financial Statements. 35,867 98,330 (150) 134,047 375,319 31,251 96,364 634 128.249 321,686 September 26, 2015 233,715 140,089 93,626 Apple Inc. CONSOLIDATED STATEMENTS OF OPERATIONS (In millions, except number of shares which are reflected in thousands and per share amounts) Years ended September 30, 2017 September 24, 2016 Net sales 229,234 $ 215.639 Cost of sales 141,048 131,376 Gross margin 88,186 84,263 Operating expenses Research and development 11,581 10.045 Selling, general and administrative 15.261 14,194 Total operating expenses 26,842 24.239 Operating income 61,344 60,024 Other income (expense), net 2,745 1,348 Income before provision for income taxes 64,089 61,372 Provision for income taxes 15,738 15,685 Net income 48,351 45,687 8,067 14,329 22,396 71,230 1.285 72,515 19.121 53,394 $ 9.27 9.21 $ $ 8.35 8.31 9.28 9.22 Earnings per share: Basic Diluted Shares used in computing earnings per share: Basic Diluted Cash dividends declared per share 5,217,242 5.251,692 2.40 5,470,820 5.500,281 2.18 5,753,421 5.793,069 1.98 See accompanying Notes to Consolidated Financial Statements. September 26, 2015 $ 53,394 (411) 2,905 Apple Inc. CONSOLIDATED STATEMENTS OF COMPREHENSIVE INCOME (In millions) Years ended September 30, 2017 September 24, 2016 Net income $ 48,351 $ 45,687 Other comprehensive income (loss): Change in foreign currency translation, net of tax effects of $(77), $8 and $201, respectively 224 75 Change in unrealized gains/losses on derivative instruments: Change in fair value of derivatives, net of tax benefit (expense) of $(478), S(7) and S(441), respectively 1,315 Adjustment for net (gains) losses realized and included in net income, net of tax expense (benefit of $475, $131 and $630, respectively (1,477) (741) Total change in unrealized gains/losses on derivative instruments, net of tax (162) (734) Change in unrealized gains/losses on marketable securities: Change in fair value of marketable securities, net of tax benefit (expense) of $425, 8(863) and $264, respectively (782) 1,582 Adjustment for net (gains) losses realized and included in net income, net of tax expense (benefit) of $35, $(31), and S(32), respectively Total change in unrealized gains/losses on marketable securities, net of tax (846) 1.638 Total other comprehensive income (loss) (784) Total comprehensive income 46.666 (3,497) (592) (483) 56 59 979 (1,427) 51.967 See accompanying Notes to Consolidated Financial Statements $ CONSOLIDATED STATEMENTS OF SHAREHOLDERS' EQUITY (In millions, except number of shares which are reflected in thousands) Accumulated Other Common Stock and Comprehensive Additional Paid-In Capital Retained Income Shares Amount Earnings (Loss) Balances as of September 27, 2014 5,866,161 $ 23,313 $ 87,152 $ 1,082 Net income 53,394 Other comprehensive income (loss) (1,427) Dividends and dividend equivalents declared (11,627) Repurchase of common stock (325,032) (36,026) Share-based compensation 3,586 Common stock issued, net of shares withheld for employee taxes 37,624 (231) (609) Tax benefit from equity awards, including transfer pricing adjustments 748 Balances as of September 26, 2015 5,578,753 $ 27,416 $ 92,284 $ (345) $ Net income 45,687 Other comprehensive income (loss) Dividends and dividend equivalents declared (12,188) Repurchase of common stock (279,609) (29,000) Share-based compensation 4.262 Common stock issued, net of shares withheld for employee taxes 37,022 (806) (419) Tax benefit from equity awards, including transfer pricing adjustments Total Shareholders' Equity 111,547 53,394 (1,427) (11,627) (36,026) 3,586 (840) 979 748 119.355 45,687 979 (12.188) (29,000) 4,262 (1,225) 379 379 979 (12,188) (29,000) 4,262 (1,225) 634 $ Other comprehensive income (loss) Dividends and dividend equivalents declared (12,188) Repurchase of common stock (279,609) (29,000) Share-based compensation 4,262 Common stock issued, net of shares withheld for employee taxes 37,022 (806) (419) Tax benefit from equity awards, including transfer pricing adjustments 379 Balances as of September 24, 2016 5,336,166 $ 31,251 $ 96,364 Net income 48,351 Other comprehensive income (loss) Dividends and dividend equivalents declared (12,803) Repurchase of common stock (246,496) (33,001) Share-based compensation 4.909 Common stock issued, net of shares withheld for employee taxes 36,531 (913) (581) Tax benefit from equity awards, including transfer pricing adjustments 620 Balances as of September 30, 2017 5,126,201 S 3 5,867 S 98,330 $ See accompanying Notes to Consolidated Financial Statements. (784) 379 128,249 48,351 (784) (12,803) (33,001) 4,909 (1,494) 620 134,047 (150) S September 26, 2015 $ 13,844 53,394 11,257 3,586 1,382 385 CONSOLIDATED STATEMENTS OF CASH FLOWS (In millions) Years ended September 30, 2017 September 24, 2016 Cash and cash equivalents, beginning of the year S 20,484 $ 21.120 Operating activities: Net income 48,351 45,687 Adjustments to reconcile net income to cash generated by operating activities: Depreciation and amortization 10,157 10,505 Share-based compensation expense 4,840 4.210 Deferred income tax expense 5.966 4,938 Other (166) 486 Changes in operating assets and liabilities: Accounts receivable, net (2,093) Inventories (2,723) 217 Vendor non-trade receivables (4,254) (51) Other current and non-current assets (5,318) 1,055 Accounts payable 9,618 1.837 Deferred revenue (626) (1.554) Other current and non-current liabilities 2,033) Cash generated by operating activities 63,598 65,824 Investing activities: Purchases of marketable securities (159,486) (142,428) Proceeds from maturities of marketable securities 31.775 21,258 Proceeds from sales of marketable securities 94,564 90,536 made in a ntinn with business acquisitions, net (329) (297) 522 417 (238) (3.735) (283) 5.001 1,042 9.058 81.266 (154) (166,402) 14,538 107,447 (343) 94,564 (329) (12,451) (344) (395) 90,536 (297) (12,734) (814) (1,388) (110) (45.977) 107,447 (343) (11,247) (241) 220 (26) (56,274) (46,446) 495 Proceeds from sales of marketable securities Payments made in connection with business acquisitions, net Payments for acquisition of property, plant and equipment Payments for acquisition of intangible assets Payments for strategic investments, net Other Cash used in investing activities Financing activities: Proceeds from issuance of common stock Excess tax benefits from equity awards Payments for taxes related to net share settlement of equity awards Payments for dividends and dividend equivalents Repurchases of common stock Proceeds from issuance of term debt, net Repayments of term debt Change in commercial paper, net Cash used in financing activities Increase (decrease) in cash and cash equivalents Cash and cash equivalents, end of the year 555 627 407 543 749 (1.499) (11.561) (35,253) 27.114 (1.874) (12,769) (32.900) 28,662 (3,500) 3,852 (17,347) (195) 20,289 (1,570) (12,150) (29,722) 24,954 (2,500) (397) (20,483) (636) 20,484 2,191 (17,716) 7.276 21,120 $ $ Supplemental cash flow disclosure: Cash paid for income taxes, net Cash paid for interest S 11,591 2,0925 10,444 1,316 $ $ 13,252 514 See accompanying Notes to Consolidated Financial Statements. Use the table below and Apple's financial statements in Appendix A to answer the following $ millions Interest expense 2017 2016 $2,323 $1,456 2015 $733 Required: 1. Compute times interest earned for each of the three years shown 2. Is Apple in a good or bad position to pay interest obligations? Assume an industry average of 10 3. Identify Apple's total accrued expenses in 2017 Complete this question by entering your answers in the tabs below. Required 1 Required 2 Required 3 Is Apple in a good or bad position to pay interest obligations? Assume an industry average of 10 Is Apple in a good or bad position? Required 3 > Good position Bad position Use the table below and Apple's financial statements in Appendix A to answer the following. $ millions Interest expense 2017 2016 2015 $2,323 $1,456 $733 Required: 1. Compute times interest earned for each of the three years shown. 2. Is Apple in a good or bad position to pay interest obligations? Assume an industry average of 10. 3. Identify Apple's total accrued expenses in 2017. Complete this question by entering your answers in the tabs below. Required 1 Required 2 Required 3 Identify Apple's total accrued expenses in 2017. (Enter your answers in millions of dollars.) Apple's total accrued expenses million Required 2 Required
Step by Step Solution
There are 3 Steps involved in it

Get step-by-step solutions from verified subject matter experts