

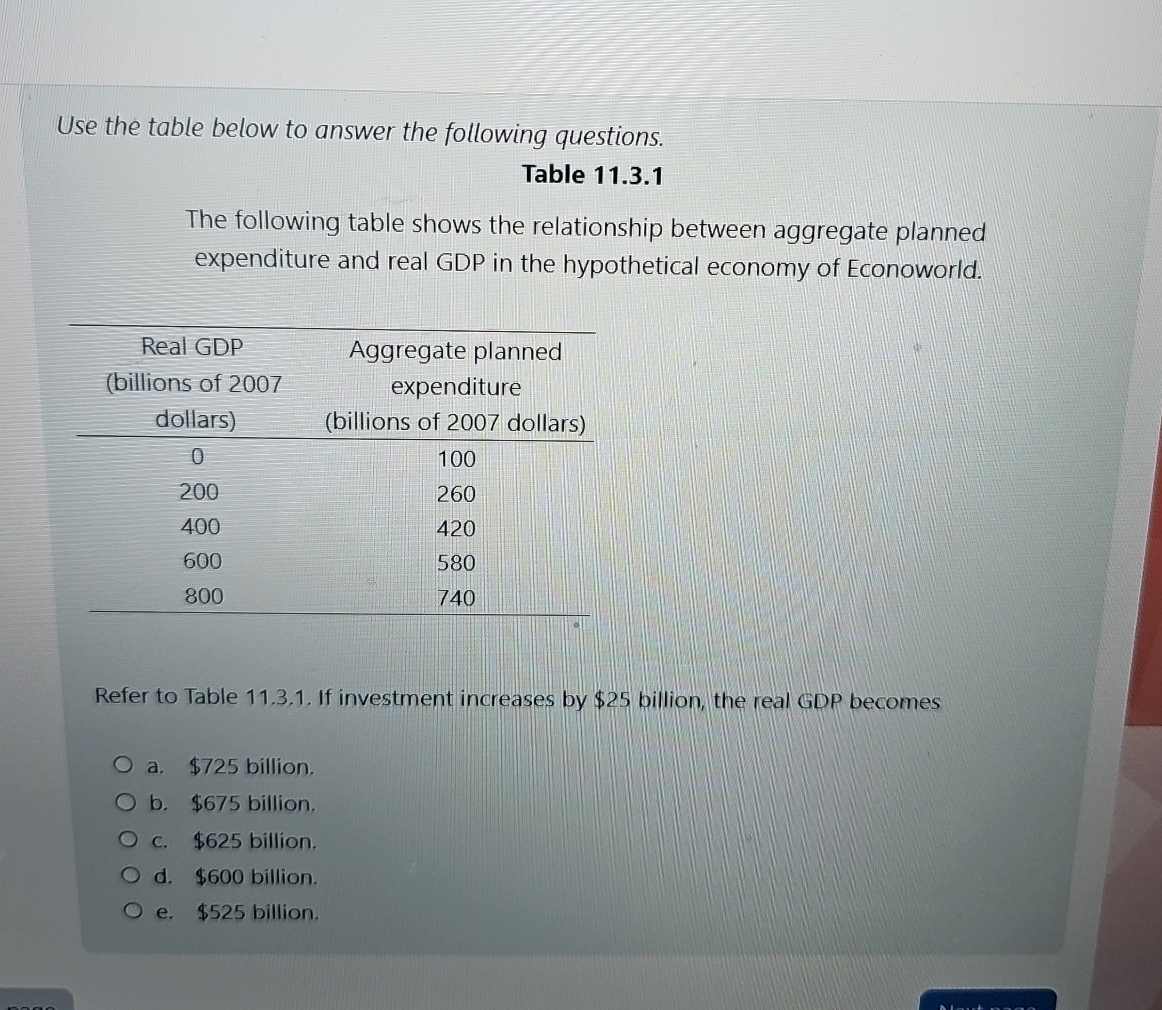
Question: Use the table below to answer the following questions. Table 1 1 . 3 . 1 The following table shows the relationship between aggregate planned
Use the table below to answer the following questions.
Table
The following table shows the relationship between aggregate planned expenditure and real GDP in the hypothetical economy of Econoworld.
tabletableReal GDPbillions of tableAggregate plannedexpenditurebillions of dollars
Refer to Table If investment increases by $ billion, the real GDP becomes
a $ billion.
b $ billion.
c $ billion.
d $ billion.
e $ billion.
Step by Step Solution
There are 3 Steps involved in it
1 Expert Approved Answer
Step: 1 Unlock

Question Has Been Solved by an Expert!
Get step-by-step solutions from verified subject matter experts
Step: 2 Unlock
Step: 3 Unlock