

Question: use the table below to make a standard curve graph Table of Absorbances for Bradford Assay: Sample Amount (?l) Absorbance at 595 nm Extract 1/10
use the table below to make a standard curve graph
Table of Absorbances for Bradford Assay:
| Sample | Amount (?l) | Absorbance at 595 nm |
|---|---|---|
| Extract 1/10 | 20 | 0.838 |
| Extract 1/100 | 20 | 0.604 |
| Extract 1/1000 | 20 | 0.577 |
| Blue Fraction (undiluted) | 20 | 0.804 |
| Blue Fraction 1/10 | 20 | 0.616 |
| Blue Fraction 1/100 | 20 | 0.561 |
| Yellow Fraction (undiluted) | 20 | 0.567 |
| Yellow Fraction 1/10 | 20 | 0.558 |
| Yellow Fraction 1/100 | 20 | 0.547 |
using the table below make an Absorbance spectra of fractions
Table of Absorbances for Bradford Assay:
Sample | Amount (?l) | Absorbance at 595 nm |
|---|---|---|
Protein Standard 0 mg/ml | 20 | 0 |
Protein Standard 0.125 mg/ml | 20 | 0.567 |
Protein Standard 0.25 mg/ml | 20 | 0.601 |
Protein Standard 0.5 mg/ml | 20 | 0.730 |
Protein Standard 0.75 mg/ml | 20 | 0.854 |
Protein Standard 1.0 mg/ml | 20 | 0.930 |
Protein Standard 1.5 mg/ml | 20 | 1.374 |
Protein Standard 2.0 mg/ml | 20 | |
Extract 1/10 | 20 | 0.838 |
Extract 1/100 | 20 | 0.604 |
Extract 1/1000 | 20 | 0.577 |
Blue Fraction (undiluted) | 20 | 0.804 |
Blue Fraction 1/10 | 20 | 0.616 |
Blue Fraction 1/100 | 20 | 0.561 |
Yellow Fraction (undiluted) | 20 | 0.567 |
Yellow Fraction 1/10 | 20 | 0.558 |
Yellow Fraction 1/100 | 20 | 0.547 |
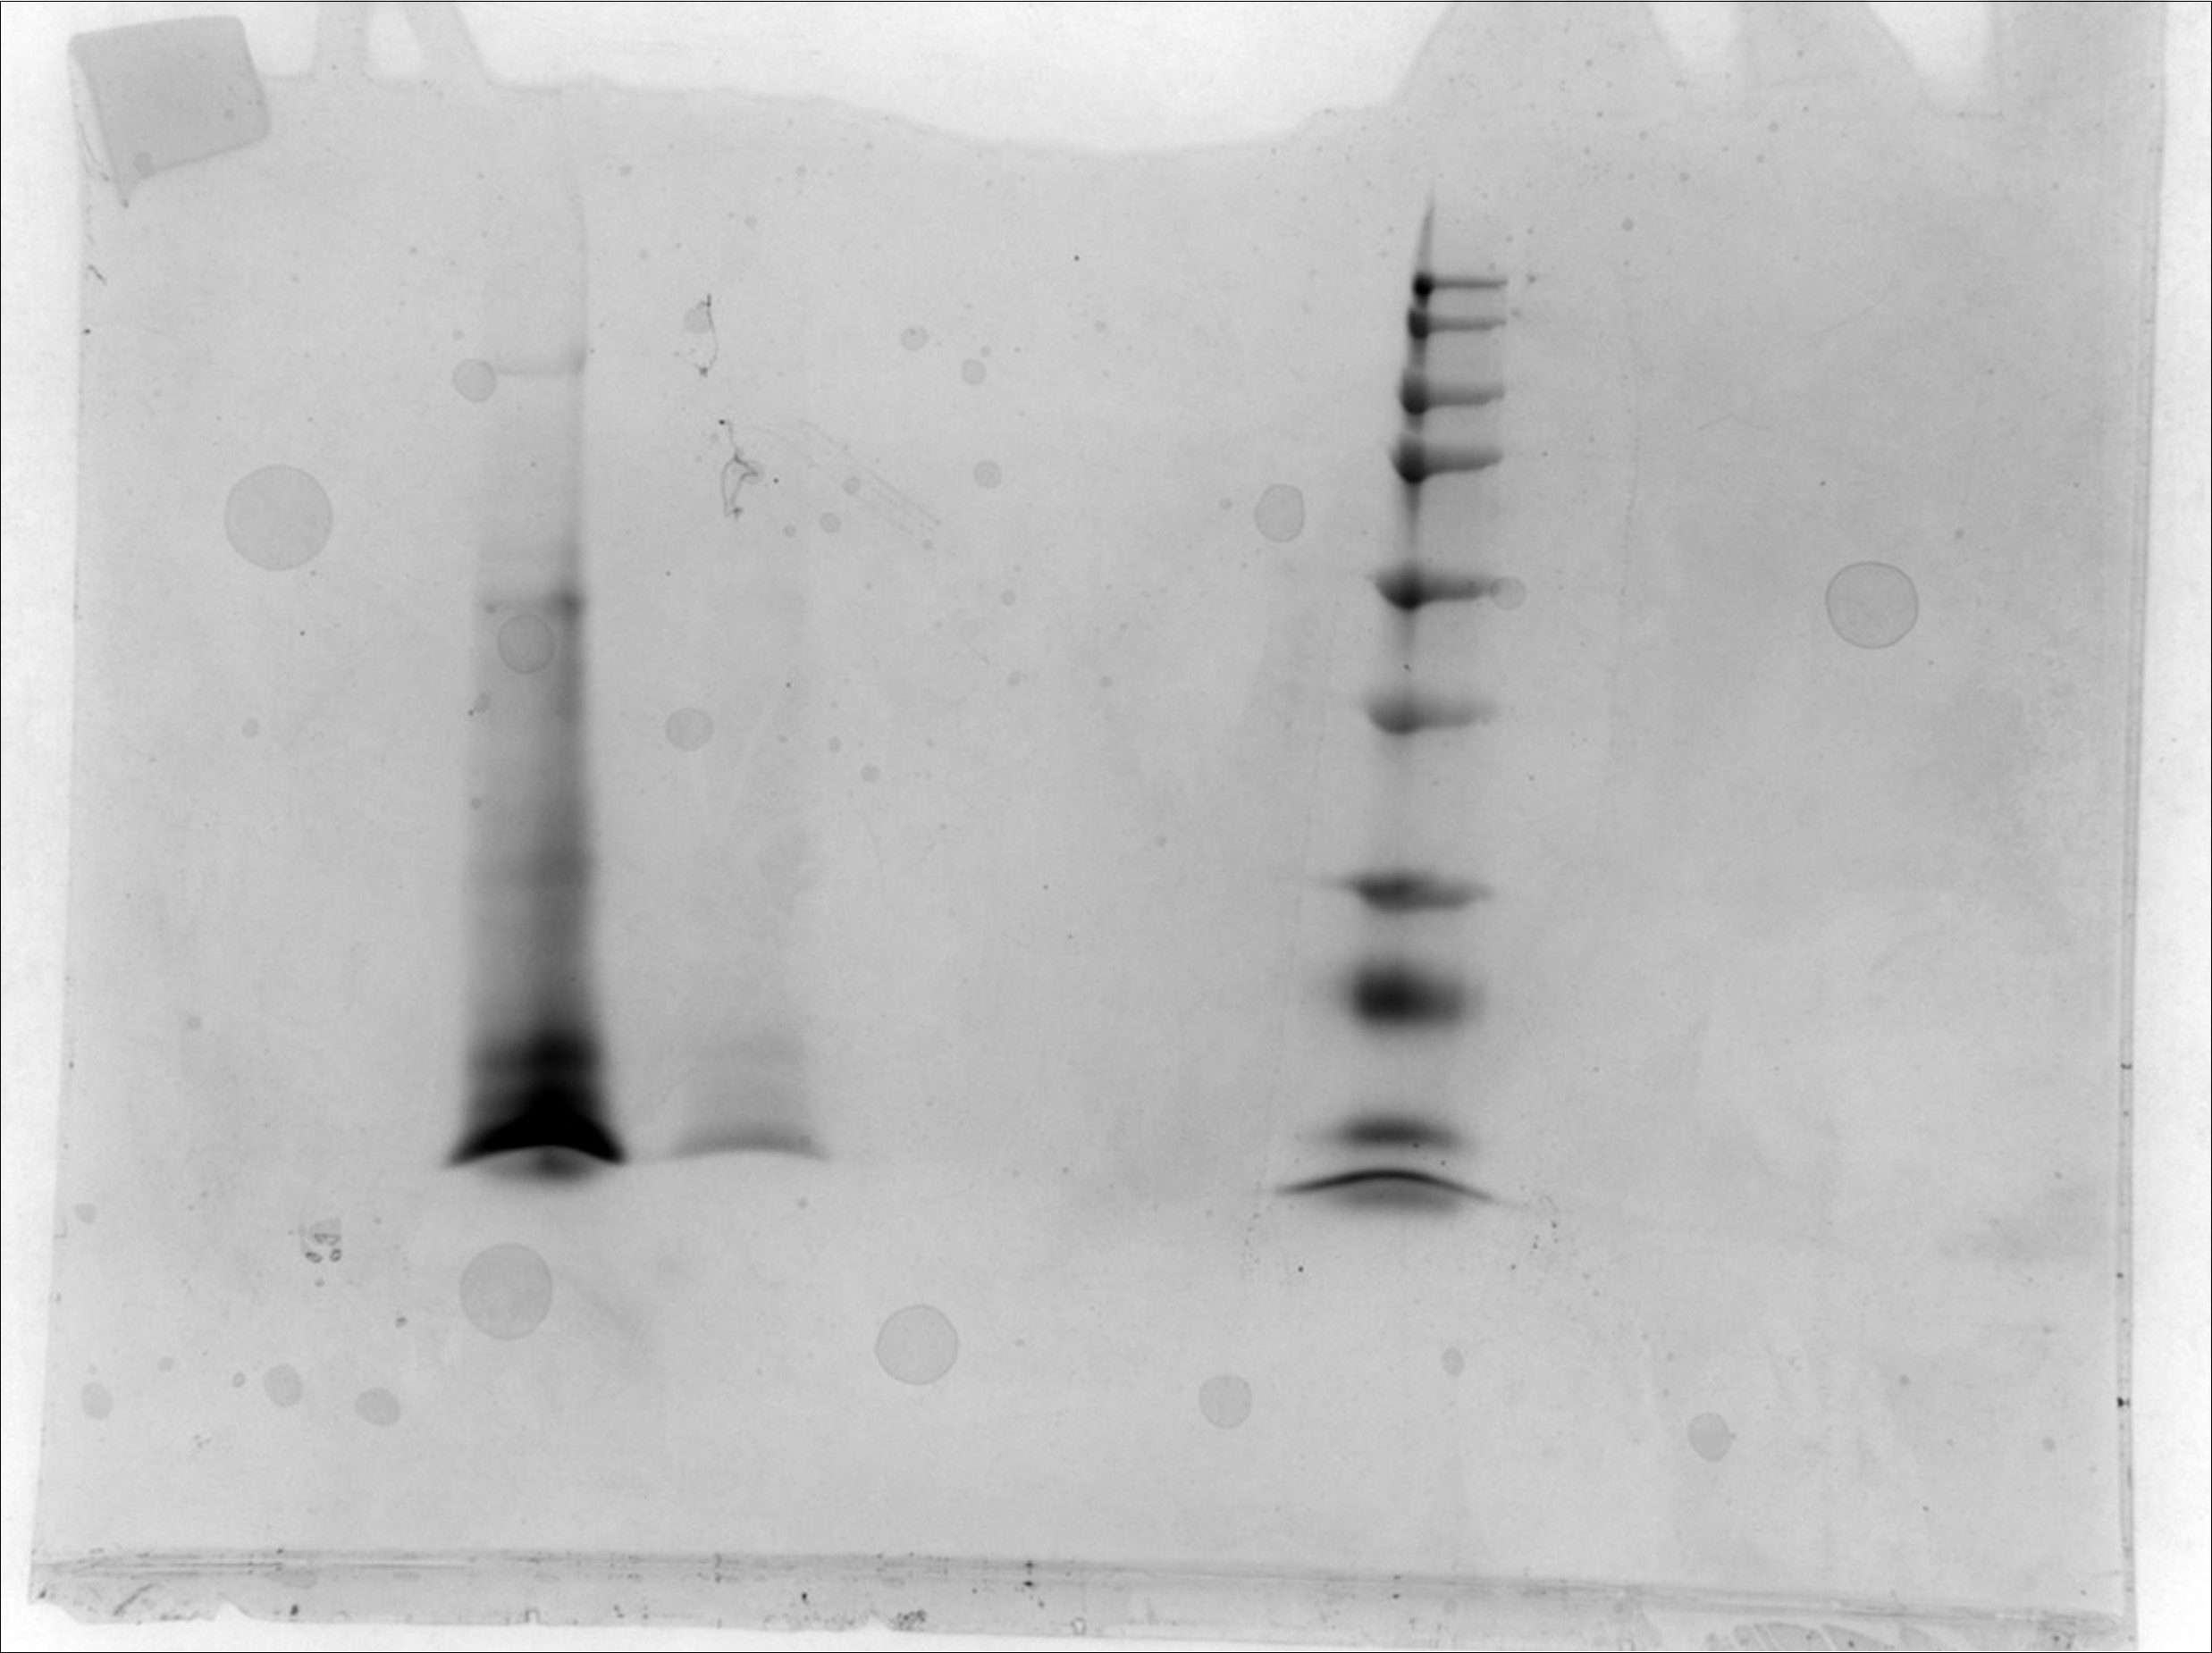
make a SDS-PAGE graph with calculations and molecular weights of purified proteins using the picture below
Step by Step Solution
There are 3 Steps involved in it

Get step-by-step solutions from verified subject matter experts