

Question: Use the table below which shows the demand and supply schedules for corn, to answer the question below. Price (dollar per ton)Quantity demanded (tons/week)Quantity Supplied
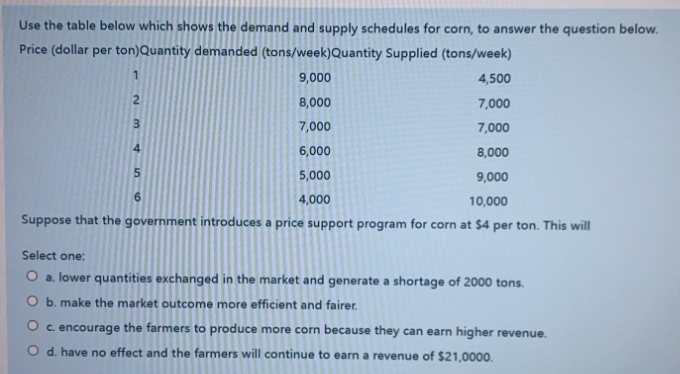
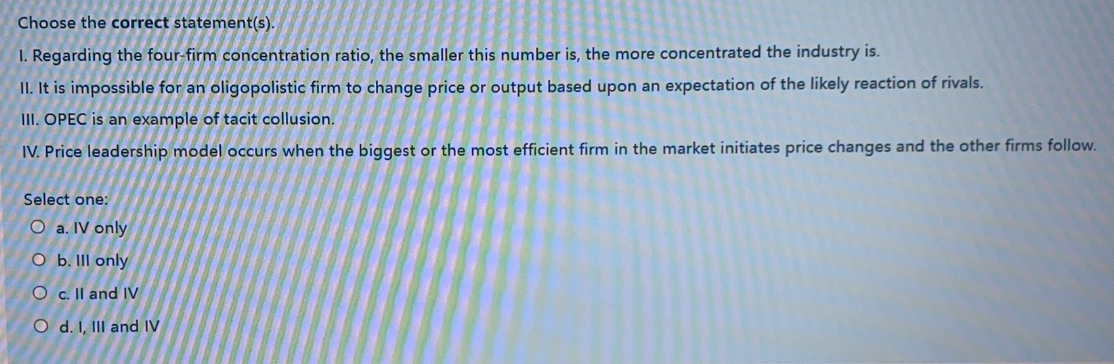
Use the table below which shows the demand and supply schedules for corn, to answer the question below. Price (dollar per ton)Quantity demanded (tons/week)Quantity Supplied (tons/week) Suppose that the government introduces a price support program for corn at $4 per ton. This will Select one: a. lower quantities exchanged in the market and generate a shortage of 2000 tons. b. make the market outcome more efficient and fairer. c. encourage the farmers to produce more corn because they can earn higher revenue. d. have no effect and the farmers will continue to earn a revenue of $21,0000. Choose the correct statement(s). I. Regarding the four-firm concentration ratio, the smaller this number is, the more concentrated the industry is. II. It is impossible for an oligopolistic firm to change price or output based upon an expectation of the likely reaction of rivals. III. OPEC is an example of tacit collusion. IV. Price leadership model occurs when the biggest or the most efficient firm in the market initiates price changes and the other firms follow. Select one: a. IV only b. III only c. II and IV d. I, III and IV
Step by Step Solution
There are 3 Steps involved in it

Get step-by-step solutions from verified subject matter experts