

Question: Use the table for area under the standard normal curve to find the area under the standard normal curve and above the interval [ -
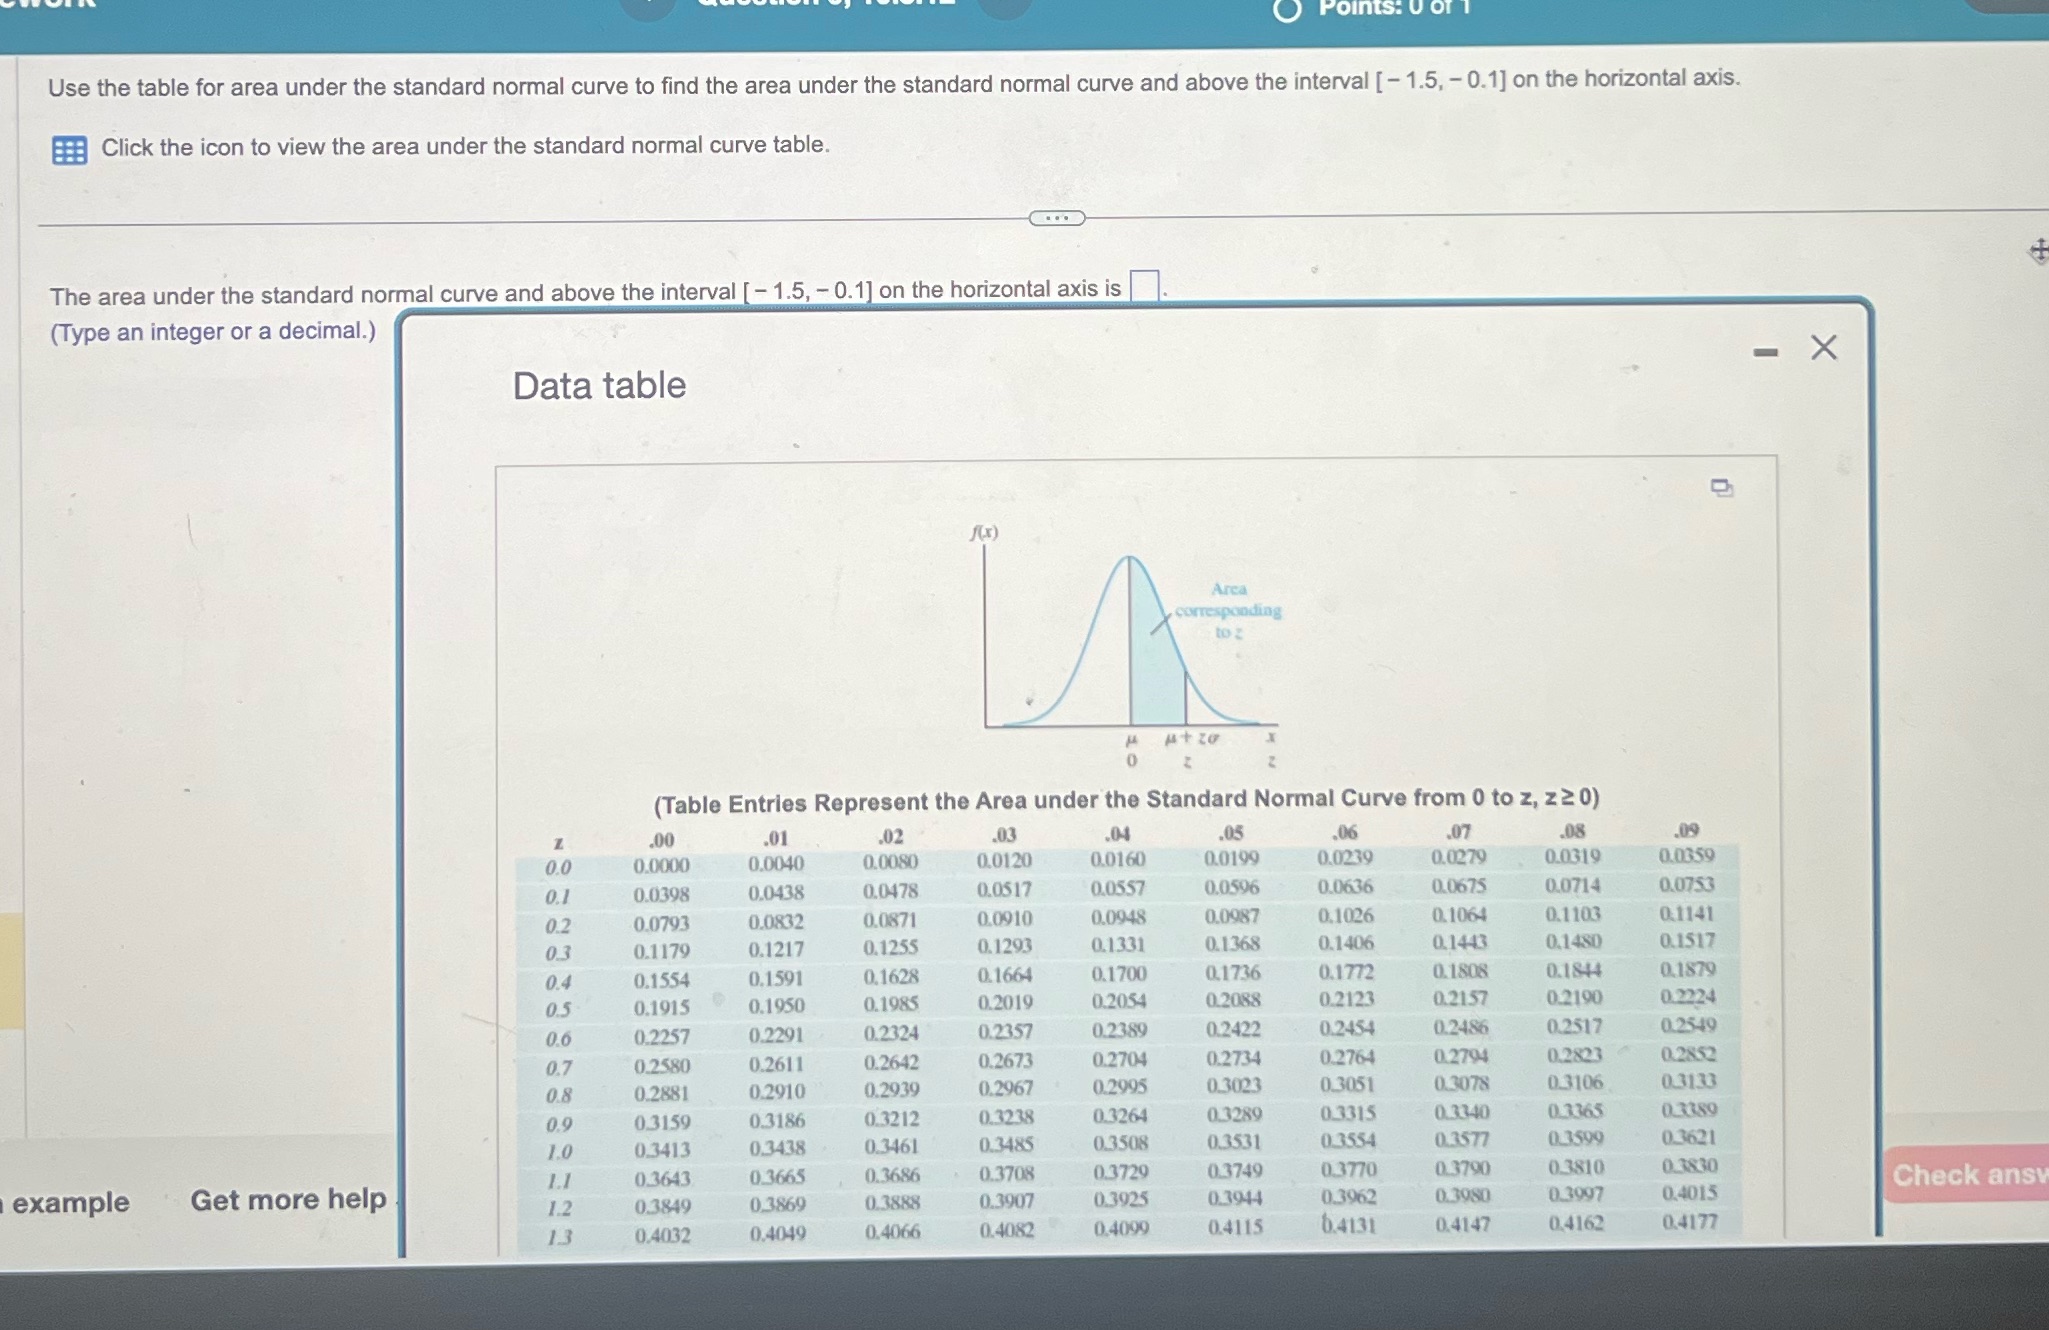
Use the table for area under the standard normal curve to find the area under the standard normal curve and above the interval [ - 1.5, - 0.1] on the horizontal axis. Click the icon to view the area under the standard normal curve table. The area under the standard normal curve and above the interval [ - 1.5, - 0.1] on the horizontal axis is (Type an integer or a decimal.) Data table - X Arca corresponding to z (Table Entries Represent the Area under the Standard Normal Curve from 0 to z, z20) .00 .01 .02 .03 .04 .05 .06 .07 .08 .09 0.0 0.0000 0.0040 0.0080 0.0120 0.0160 0.0199 0.0239 0.0279 0.0319 0.0359 0.1 0.0398 0.0438 0.0478 0.0517 0.0557 0.0596 0.0636 0.0675 0.0714 0.0753 0.2 0.0793 0.0832 0.0871 0.0910 0.0948 0.0987 0.1026 0.1064 0.1103 0.1141 03 0.1179 0.1217 0.1255 0.1293 0.1331 0.1368 0.1406 0.1443 0.1480 0.1517 0.4 0.1554 0.1591 0.1628 0.1664 0.1700 0.1736 0.1772 0.1808 0.1844 0.1879 0.1915 0.1950 0.1985 0.2019 0.2054 0.2088 0.2123 0.2157 0.2190 0.2224 0.6 0.2257 0.2291 0.2324 0.2357 0.2389 0.2422 0.2454 0.2486 0.2517 0.2549 0.7 0.2580 0.2611 0.2642 0.2673 0.2704 0.2734 0.2764 0.2794 0.2823 0.2852 0.8 0.2881 0.2910 0.2939 0.2967 0.2995 0.3023 0.3051 0.3078 0.3106 0.3133 0.9 0.3159 0.3186 0.3212 0.3238 0.3264 0.3289 0.3315 0.3340 0.3365 0.3380 1.0 0.3413 0.3438 0.3461 0.3485 0.3508 0.3531 0.3554 0.3577 0.3599 0.3621 Get more help 1.1 0.3643 0.3665 example 0.3686 0.3708 0.3729 0.3749 0.3770 0.3790 0.3810 0.3830 1.2 0.3849 0.3869 0.3888 0.3907 0.3925 0.3944 0.3962 0.3980 0.3997 0.4015 Check ans 13 0.4032 0.4049 0.4066 0.4082 0.4099 0.4115 6.4131 0.4147 0.4162 0.4177
Step by Step Solution
There are 3 Steps involved in it

Get step-by-step solutions from verified subject matter experts