

Question: Use the table to find the probability. The table shows the number of college students who prefer a given pizza topping. toppings freshman sophomore junior
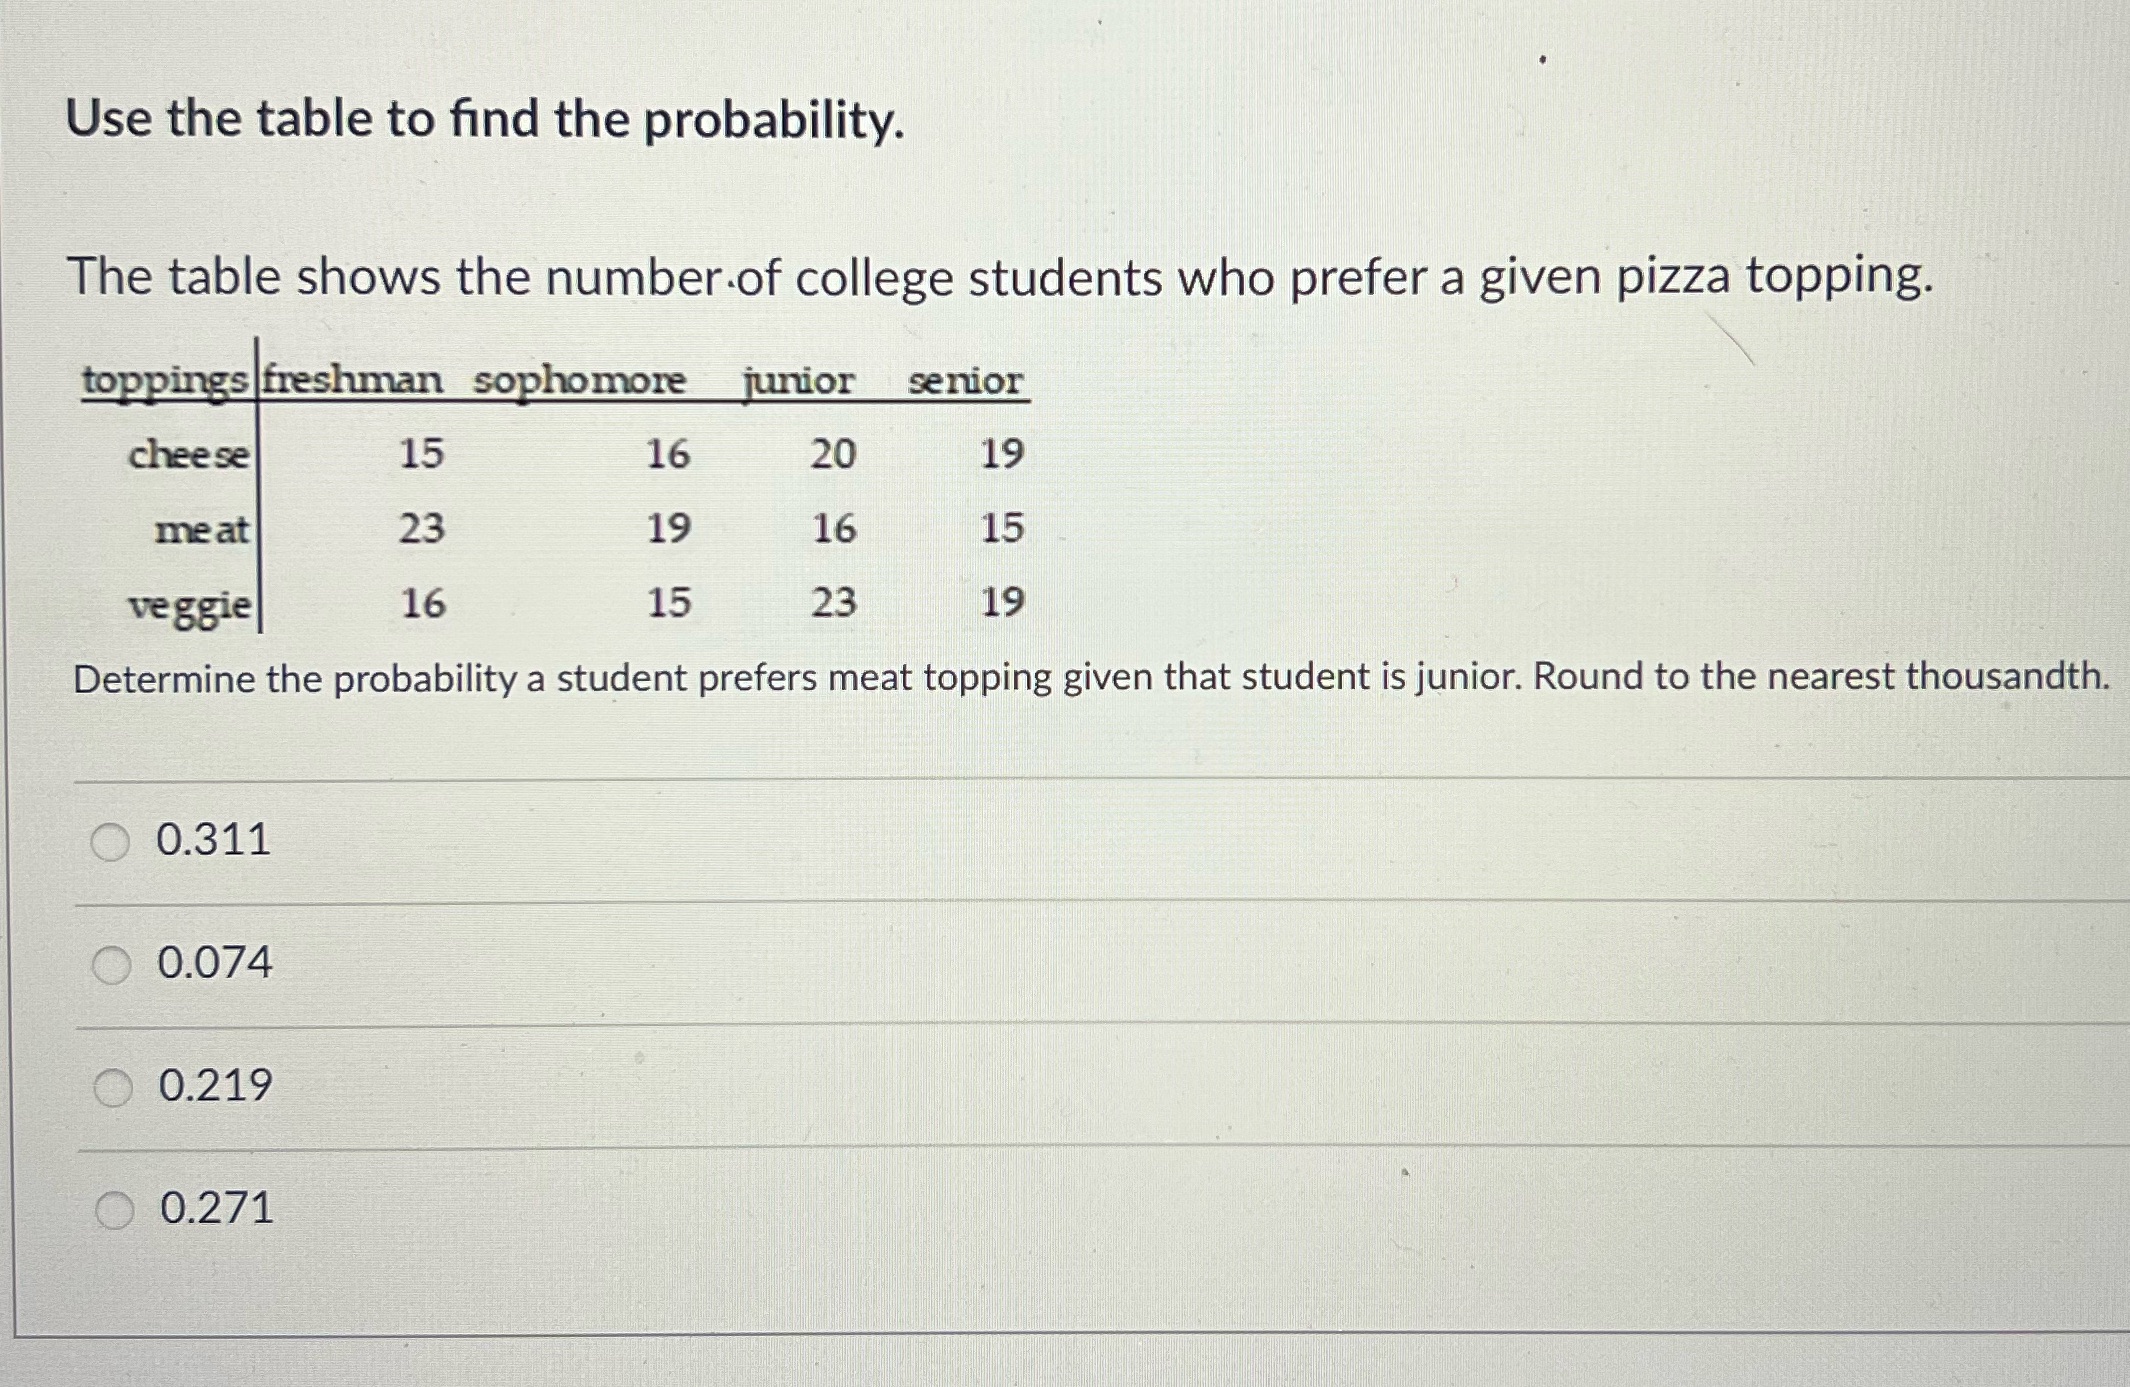
Use the table to find the probability. The table shows the number of college students who prefer a given pizza topping. toppings freshman sophomore junior senior cheese 15 16 20 19 me at 23 19 16 15 veggie 16 15 23 19 Determine the probability a student prefers meat topping given that student is junior. Round to the nearest thousandth. O 0.311 O 0.074 0.219 O 0.271
Step by Step Solution
There are 3 Steps involved in it
1 Expert Approved Answer
Step: 1 Unlock

Question Has Been Solved by an Expert!
Get step-by-step solutions from verified subject matter experts
Step: 2 Unlock
Step: 3 Unlock