

Question: Use the Thomas et al. (2011) study to answer the following questions. (pictures are above)! 7. What is the population and sampling population for this
- Use the Thomas et al. (2011) study to answer the following questions. (pictures are above)!
7. What is the population and sampling population for this research?
8. Is random sampling a critical issue for this research?
9. Can you identify the independent and dependent variables in this study?
10. Are the independent variables manipulated or subject variables?
11. Which scale of measurement best represents:
- (a) Amount spent on the food
- (b) The food type?
- (c) The method of payment?
- (d) Pain of payment
12. Thomas et al. used a cover story for their first study. How does the cover story relate to face validity?
13. Why is pain of payment an intervening variable?
14. What is the operational definition of pain of payment in this study?
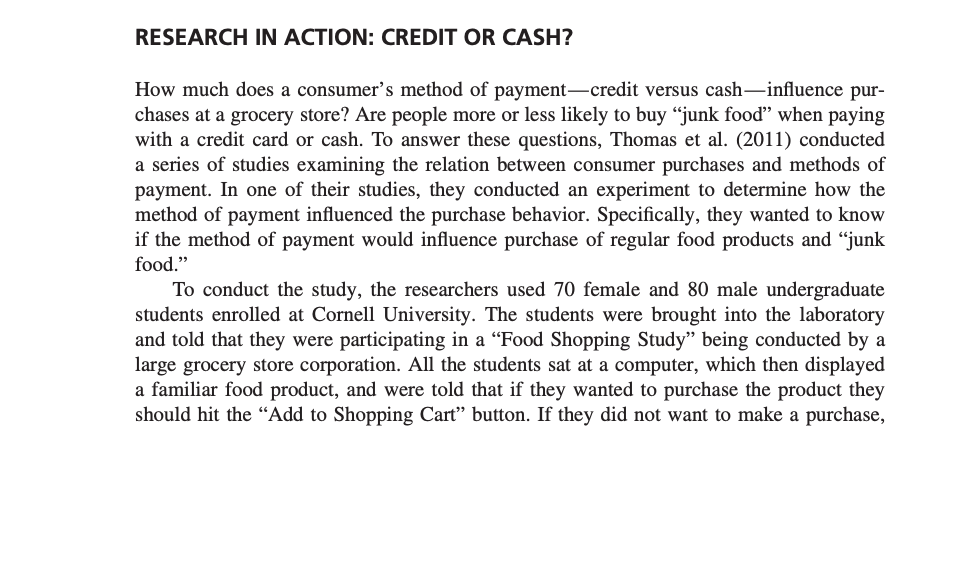
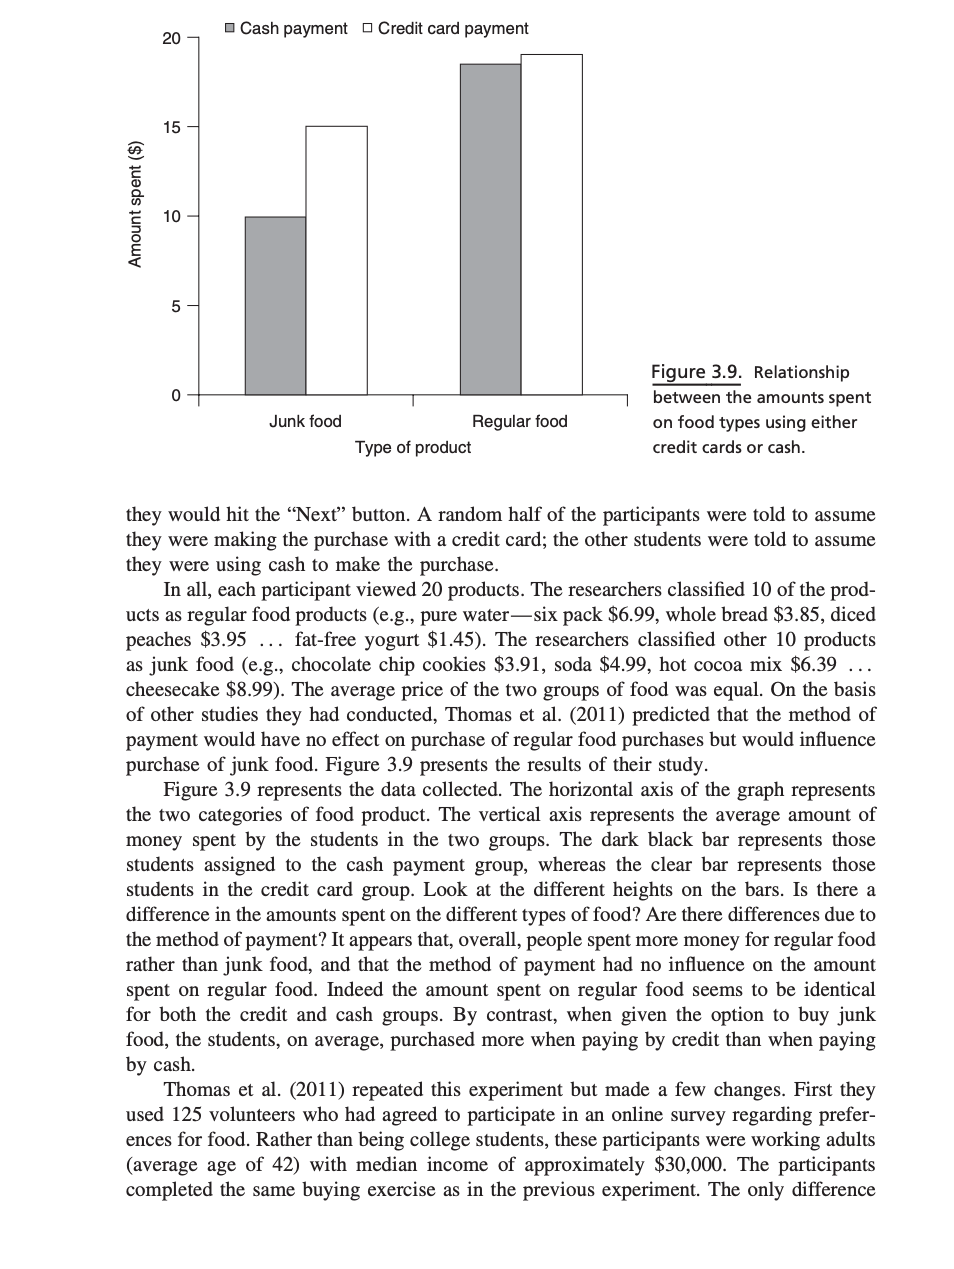
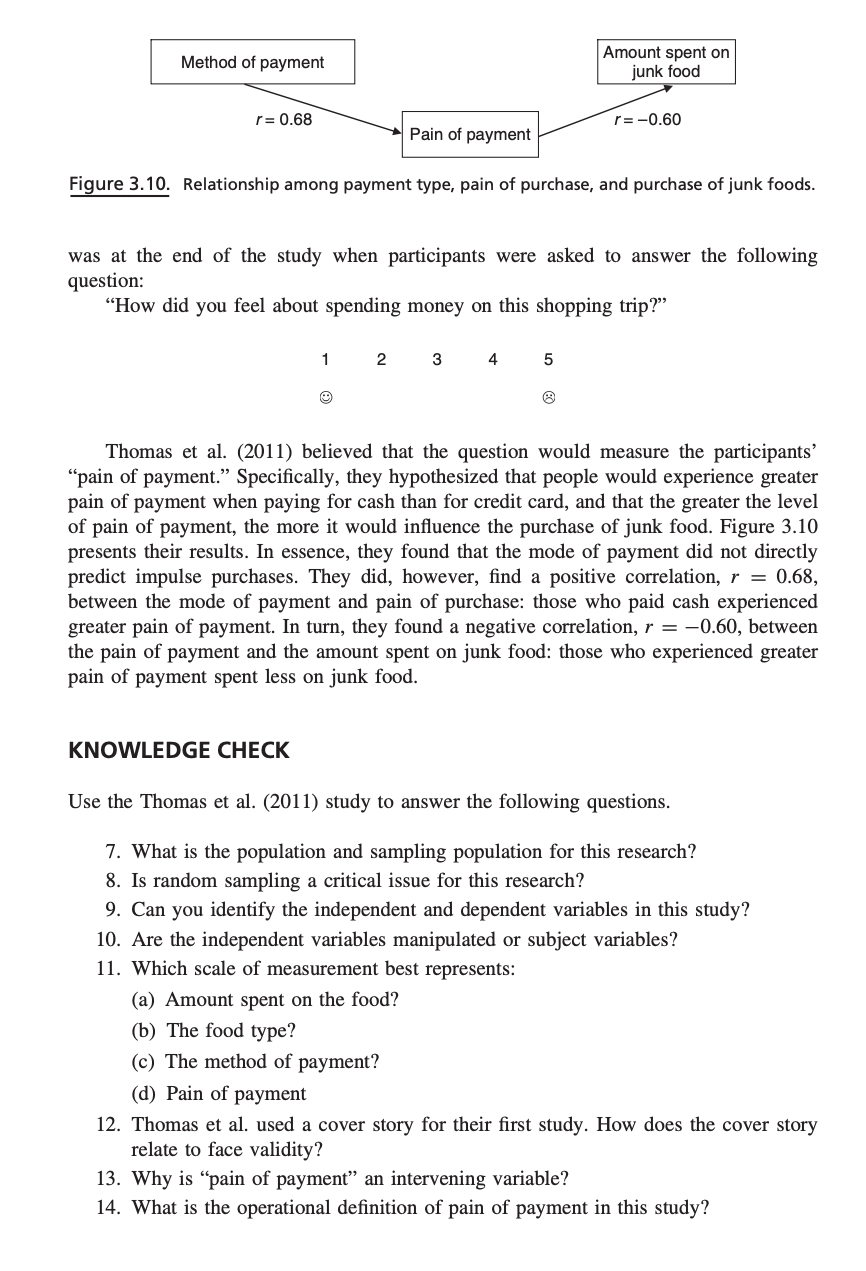
RESEARCH IN ACTION: CREDIT OR CASH? How much does a consumer's method of payment credit versus cash influence purchases at a grocery store? Are people more or less likely to buy "junk food" when paying with a credit card or cash. To answer these questions, Thomas et al. (2011) conducted a series of studies examining the relation between consumer purchases and methods of payment. In one of their studies, they conducted an experiment to determine how the method of payment influenced the purchase behavior. Specifically, they wanted to know if the method of payment would influence purchase of regular food products and "junk food." To conduct the study, the researchers used 70 female and 80 male undergraduate students enrolled at Cornell University. The students were brought into the laboratory and told that they were participating in a "Food Shopping Study" being conducted by a large grocery store corporation. All the students sat at a computer, which then displayed a familiar food product, and were told that if they wanted to purchase the product they should hit the "Add to Shopping Cart" button. If they did not want to make a purchase, Figure 3.10. Relationship among payment type, pain of purchase, and purchase of junk foods. was at the end of the study when participants were asked to answer the following question: "How did you feel about spending money on this shopping trip?" Thomas et al. (2011) believed that the question would measure the participants' "pain of payment." Specifically, they hypothesized that people would experience greater pain of payment when paying for cash than for credit card, and that the greater the level of pain of payment, the more it would influence the purchase of junk food. Figure 3.10 presents their results. In essence, they found that the mode of payment did not directly predict impulse purchases. They did, however, find a positive correlation, r=0.68, between the mode of payment and pain of purchase: those who paid cash experienced greater pain of payment. In turn, they found a negative correlation, r=0.60, between the pain of payment and the amount spent on junk food: those who experienced greater pain of payment spent less on junk food. KNOWLEDGE CHECK Use the Thomas et al. (2011) study to answer the following questions. 7. What is the population and sampling population for this research? 8. Is random sampling a critical issue for this research? 9. Can you identify the independent and dependent variables in this study? 10. Are the independent variables manipulated or subject variables? 11. Which scale of measurement best represents: (a) Amount spent on the food? (b) The food type? (c) The method of payment? (d) Pain of payment 12. Thomas et al. used a cover story for their first study. How does the cover story relate to face validity? 13. Why is "pain of payment" an intervening variable? 14. What is the operational definition of pain of payment in this study? igure 3.9. Relationship etween the amounts spent n food types using either redit cards or cash. they would hit the "Next" button. A random half of the participants were told to assume they were making the purchase with a credit card; the other students were told to assume they were using cash to make the purchase. In all, each participant viewed 20 products. The researchers classified 10 of the products as regular food products (e.g., pure water-six pack $6.99, whole bread $3.85, diced peaches $3.95 fat-free yogurt $1.45). The researchers classified other 10 products as junk food (e.g., chocolate chip cookies $3.91, soda $4.99, hot cocoa mix $6.39 cheesecake \$8.99). The average price of the two groups of food was equal. On the basis of other studies they had conducted, Thomas et al. (2011) predicted that the method of payment would have no effect on purchase of regular food purchases but would influence purchase of junk food. Figure 3.9 presents the results of their study. Figure 3.9 represents the data collected. The horizontal axis of the graph represents the two categories of food product. The vertical axis represents the average amount of money spent by the students in the two groups. The dark black bar represents those students assigned to the cash payment group, whereas the clear bar represents those students in the credit card group. Look at the different heights on the bars. Is there a difference in the amounts spent on the different types of food? Are there differences due to the method of payment? It appears that, overall, people spent more money for regular food rather than junk food, and that the method of payment had no influence on the amount spent on regular food. Indeed the amount spent on regular food seems to be identical for both the credit and cash groups. By contrast, when given the option to buy junk food, the students, on average, purchased more when paying by credit than when paying by cash. Thomas et al. (2011) repeated this experiment but made a few changes. First they used 125 volunteers who had agreed to participate in an online survey regarding preferences for food. Rather than being college students, these participants were working adults (average age of 42) with median income of approximately $30,000. The participants completed the same buying exercise as in the previous experiment. The only difference
Step by Step Solution
There are 3 Steps involved in it

Get step-by-step solutions from verified subject matter experts