

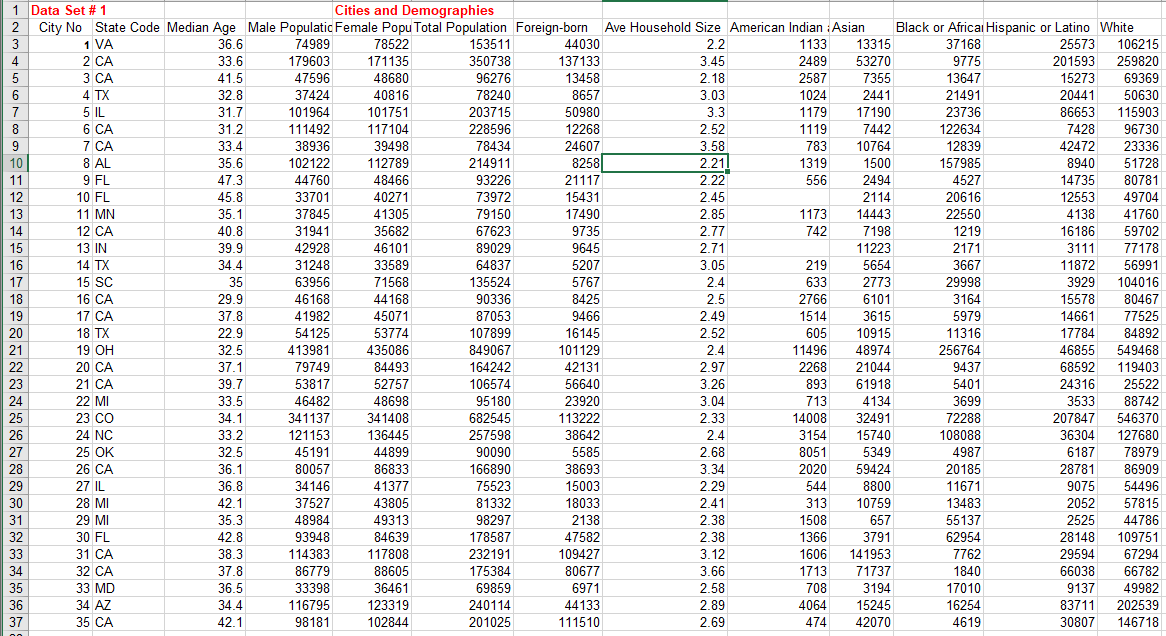
Question: Use the US Cities and Demographics d ata sets - Gender Comparison between Female and Male population. - Analysis of population by racial breakdown. Graph
Use the US Cities and Demographics data sets
- Gender Comparison between Female and Male population.
- Analysis of population by racial breakdown.
Graph a Box plot of the Male and Female population (side by side) and descriptive statistics tables using EXCEL or any other software.
Write a comparative report based on the results; including M & F trends in terms of symmetry and outlying observation(s), Female (% of total population), measures of central tendencies, and measures of dispersion. Explain by calculation, which population shows more volatility.
Use an appropriate graph to plot Racial/ Ethnicity. Which one ofthe 3 measures of central tendencies do you recommend to show the most typical group?
Fist find the 5 Most Populated States (MPS), then setup a contingency table between MPS and Racial/ Ethnicity (5 by 5 table).Using your table to answer:
What percentage of Californian is White?
What percentage is non White and from California?
What percentage is Black or from California?
What percentage of people identify as Racial/Ethnic minorities?
Compute the percentages of Population By Race,highlight which state is more racially/ethnically divers?.
\f
Step by Step Solution
There are 3 Steps involved in it

Get step-by-step solutions from verified subject matter experts