

Question: Use the weather map and cross-section to answer the following questions. This is a critical thinking exercise so you will have to apply your
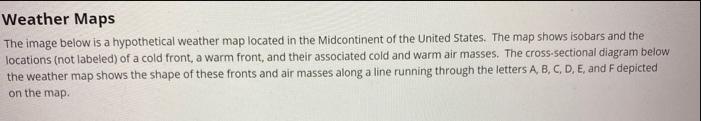
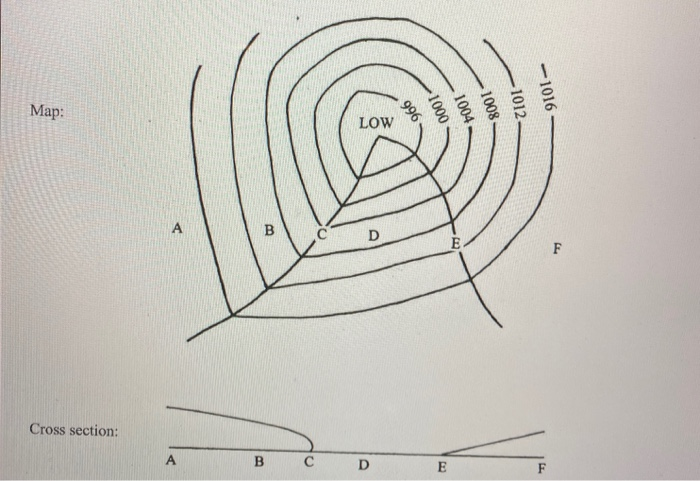
Use the weather map and cross-section to answer the following questions. This is a critical thinking exercise so you will have to apply your knowledge of mid-latitude cyclones to determine the correct answers. Add these answers to the attached answer worksheet and submit the worksheet for a grade using the Assignments Tool in ACE. 1. At which location on the map and cross-section (A, B, C, D, E, or F) is the cold front? 2. At which location on the map and cross-section (A, B, C, D, E, or F) is the warm front? 3. At which location on the map and cross-section (A-C, C-E, or E-F) is the cold air mass? 4. At which location on the map and cross-section (A-C, C-E, or E-F) is the warm air mass? 5. In which direction (North to South, South to North, West to East, East to West) is the storm moving? 6. What is the most likely wind direction (North, South, East, West) at Point D? 7. At Point D, is the pressure rising or falling? 8. Why is the pressure rising or falling at Point D? Base your answer on your answer to Question 7. 9. Is precipitation more likely at Point D or Point C? 10. Why is precipitation more likely at this point? Base your answer on your answer to Question 9. 11. At Point C, what general temperature change will take place with the passing of the cold front (will the temperature increase or decrease)? 12. Why will the temperature increase or decrease? Base your answer on your answer to Question 11. 13. What is the most likely wind direction (North, South, East, West) at Point B? 14. At Point B, is the pressure rising or falling? 15. Why is the pressure rising or falling at Point B? Base your answer on your answer to Question 14. Weather Maps The image below is a hypothetical weather map located in the Midcontinent of the United States. The map shows isobars and the locations (not labeled) of a cold front, a warm front, and their associated cold and warm air masses. The cross-sectional diagram below the weather map shows the shape of these fronts and air masses along a line running through the letters A, B, C, D, E, and F depicted on the map. Map: Cross section: A B B LOW D D 966 1000 E 1004 1008- -1012. 9101->
Step by Step Solution
3.52 Rating (152 Votes )
There are 3 Steps involved in it

Get step-by-step solutions from verified subject matter experts