

Question: Use the Week 5 Data Get to create and calculate the following in Excel 1 . Conduct a goodness of fit analysis which assesses orders
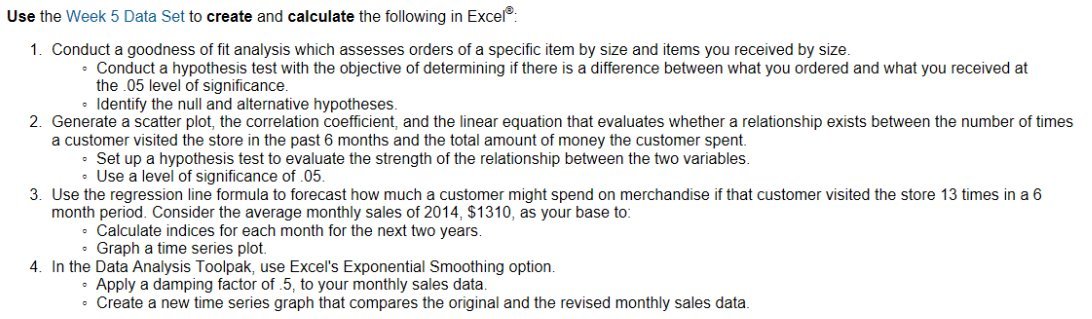
Use the Week 5 Data Get to create and calculate the following in Excel 1 . Conduct a goodness of fit analysis which assesses orders of a specific item by size and items you received by size . Conduct a hypothesis test with the objective of determining if there is a diference between what you ordered and what you received at the . 05 level of significance .* . Identify the null and alternative hypotheses . 2. Generate a scatter plot , the correlation coefficient , and the linear equation that evaluates whether a relationship exists between the number of times a customer visited the store in the past 6 months and the total amount of money the customer spent . Set up a hypothesis test to evaluate the strength of the relationship between the two variables . . Use a level of significance of . 05. 3. Use the regression line formula to forecast how much a customer might spend on merchandise if that customer visited the store 13 times in a 6 month period . Consider the average monthly sales of 2014 , $1310 , as your base to` . Calculate indices for each month for the next two years Graph a time series plot .\\ 4 . In the Data Analysis Toolpak , use Excel's Exponential Smoothing option . Apply a damping factor of . 5 , to your monthly sales data . Create a new time series graph that compares the original and the revised monthly sales data
Step by Step Solution
There are 3 Steps involved in it

Get step-by-step solutions from verified subject matter experts